

The Quick Read
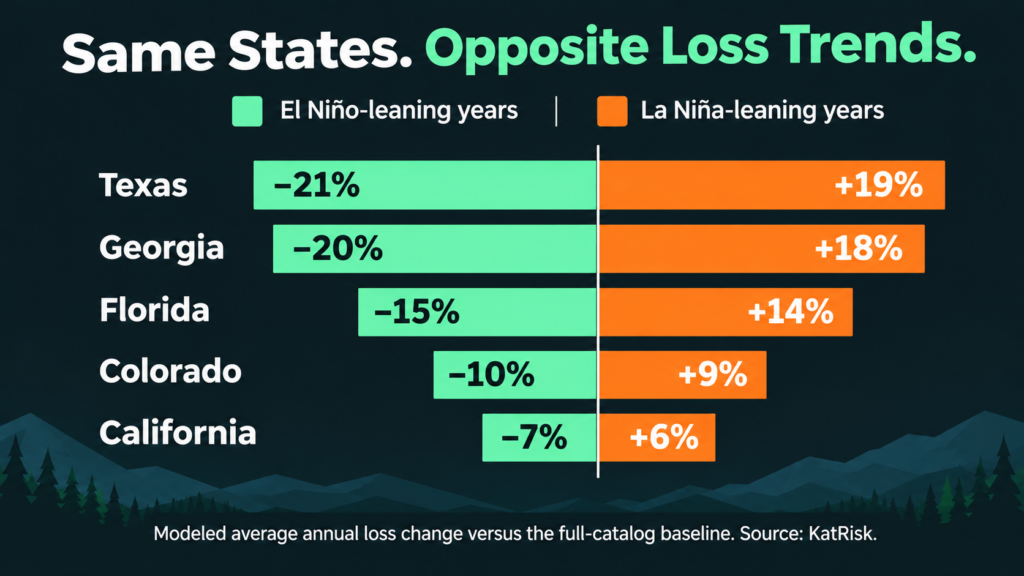
A potentially historic El Niño is taking shape, and new research from KatRisk shows how it could reshape U.S. wildfire losses heading into 2027. In El Niño-leaning years, modeled average annual wildfire losses decline across much of the South, including approximately 21% in Texas, 20% in Georgia and 15% in Florida. The pattern reverses across parts of the northern U.S., where expected losses increase. A subsequent shift toward La Niña could reverse those trends.
But lower average losses do not eliminate the potential for major wildfires. Wet El Niño winters can accelerate grass and fine-fuel growth, creating additional exposure as vegetation dries. For underwriters, reinsurers and portfolio managers, the challenge is understanding how these shifting regional trends affect both near-term exposure and risk heading into 2027-28.
How Property Guardian Helps: Property Guardian complements KatRisk’s portfolio-level modeling with Wildfire Susceptibility Scores that assess property-level Hazard and Recurrence Risk, while Overwatch monitors active wildfire threats. Together, they help insurers translate shifting regional trends into more informed underwriting and risk decisions.
Our partners at KatRisk just published one of the clearest looks we have seen at how the El Niño–Southern Oscillation (ENSO) moves US wildfire loss: El Niño Watch: How ENSO Shifts U.S. Wildfire Losses. It is required reading for anyone pricing, accumulating or reinsuring wildfire exposure heading into 2027.
The timing matters. NOAA’s Climate Prediction Center put the odds at 83% that this fall’s event will be stronger than any El Niño on record since 1950. KatRisk used its stochastic wildfire model to ask what that tilt does to average annual loss (AAL), state by state and county by county. Below, we summarize what they found and share how we think about it at Property Guardian.
What KatRisk Found
KatRisk split its stochastic wildfire catalog by ENSO phase in each simulated year, then compared El Niño-leaning and La Niña-leaning years against the full-catalog baseline. The headline is a north-south split that runs in opposite directions.
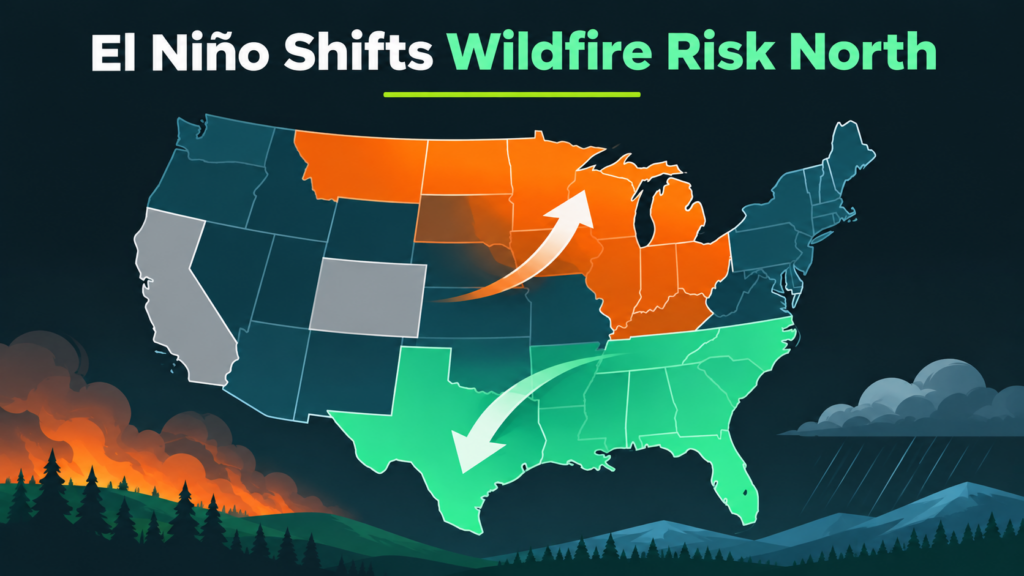
- The South gets relief under El Niño. AAL drops across most of the southern tier, from California and the Desert Southwest through Texas, the Gulf Coast and Florida. La Niña flips it almost exactly.
- The North moves the other way. El Niño raises AAL in Montana, North Dakota, Minnesota, Wisconsin, Michigan and the Ohio Valley.
- The West is more muted. California and Colorado shift less, and KatRisk notes that Santa Ana and Diablo winds remain bigger drivers of the Western season.
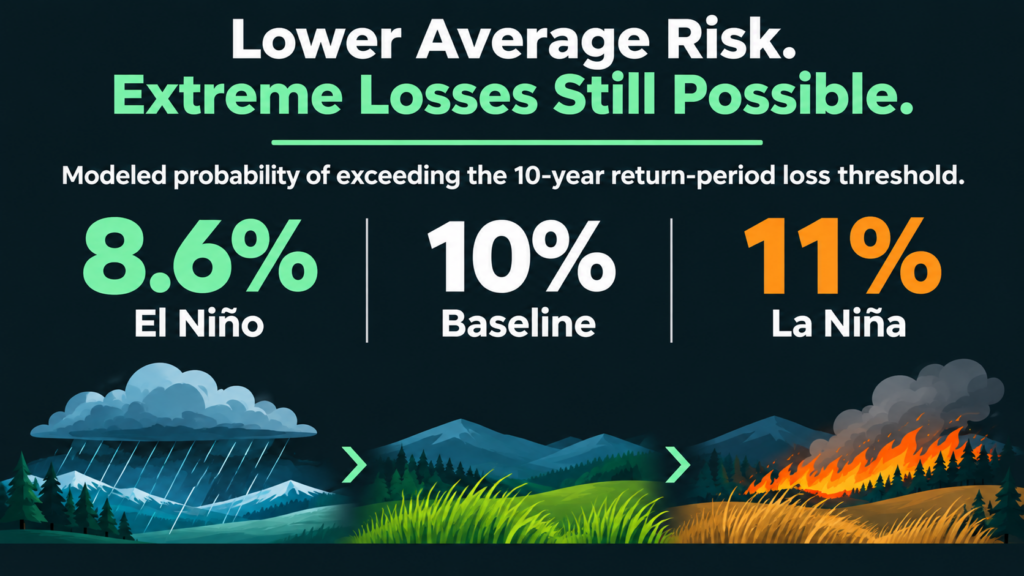
- The tail shifts too. Years exceeding the 10-year return period loss fall from 10% overall to 8.6% in El Niño-leaning years, and rise to 11% in La Niña-leaning years.
Two cautions in the piece deserve the most attention. First, as KatRisk puts it, “A lower average does not mean a season without major fires.” Second, the delayed fuel effect: a wet El Niño winter grows grasses and fine fuels that cure later. Strong El Niño events are often followed by La Niña, the higher-loss phase for much of the South and West, which makes 2027–28 a season to watch. KatRisk sums it up well: “ENSO shifts the odds; it does not set the outcome.”
Why This Matters for Underwriters and Portfolio Managers
KatRisk’s work answers a portfolio question: how does the expected loss of a book shift when the climate signal tilts one way or the other? That is exactly the lens reinsurers, cat modelers and capital teams need for 2027 planning.
A few practical takeaways we are discussing with our clients:
- Don’t treat southern relief as a pricing holiday. A lower average still allows a large event, and the fuel crop from a wet winter can carry risk forward into the next season.
- Revisit northern exposure. Books concentrated in the Upper Midwest and Ohio Valley may not usually top wildfire watch lists, but El Niño pushes their expected loss up.
- Plan two seasons ahead. If La Niña follows, the 2027–28 picture across the South and West could look very different from this winter’s.
Where Property-Level Data Fits
A state-level shift of 15 or 20% tells you which way the wind is blowing for the portfolio. It doesn’t tell you which properties inside that state are carrying the risk. That is where KatRisk’s catastrophe model view and Property Guardian’s property-level wildfire intelligence work together.
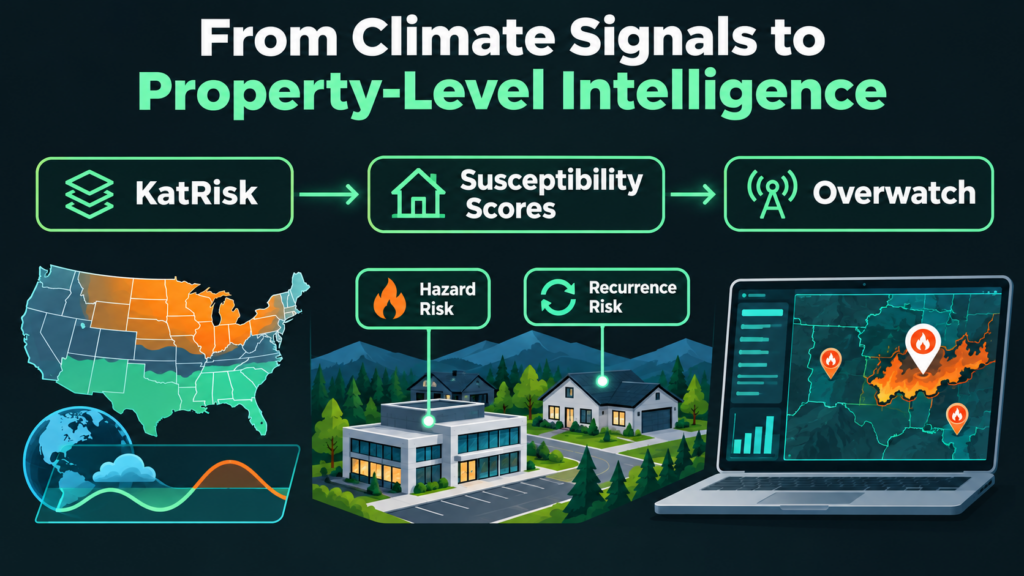
- Wildfire Susceptibility Scores pair Hazard Risk with Recurrence Risk, a timing view of how long it has been since an area last burned relative to its fire history. Perimeter history refreshes every two weeks, so the frequency clock resets as fires happen. That helps underwriters separate risks that are far from due from those that are overdue, even inside a region where ENSO is lowering the average.
- Overwatch monitors active fires against client portfolios in real time, which matters most in exactly the scenario KatRisk flags: a below-average year that still produces a major event.
KatRisk’s account teams already position Susceptibility Scores alongside their catastrophe model outputs. ENSO is a good example of why the combination works: the model sets the portfolio-level expectation, and property-level data helps you act on it one risk at a time.
The Bottom Line
El Niño tilts the odds toward a quieter southern season and a busier northern one, but it doesn’t take a costly wildfire year off the table. We encourage everyone to read the full KatRisk article, including its state and county maps, and to reach out to the KatRisk team about their wildfire model.
To see how Wildfire Susceptibility Scores and Overwatch can sharpen your view of the 2027 season at the property level, contact the Property Guardian team.
Sources
KatRisk, El Niño Watch: How ENSO Shifts U.S. Wildfire Losses
KatRisk, Wildfire model and catastrophe models
NOAA Climate Prediction Center, ENSO Diagnostic Discussion
NOAA, El Niño looms large over U.S. Winter Outlook
Cardil, A., et al. (2023), Climate teleconnections modulate global burned area, Nature Communications
