


• Skip to main content
  • Skip to header right navigation
  • Skip to site footer
Property Guardian

Property Guardian

  • About Us
    • About Us
    • Our Team
    • Our Partners
  • Solutions
        • Underwriting

        • Large Commercial Property
        • Specialty Lines
        • High-Volume & Transactional Property
        • Ultra-High Net Worth Homeowners
        • Loss Control & Risk Management

        • Loss Control Teams
        • Insurance Brokers
        • Corporate Risk Management
        • Wildfire Risk Mitigation & Response Vendors
        • Property Inspection Companies
        • CAT Modeling & Reinsurance
  • Products
        • Wildfire Risk Assessment

        • Wildfire Susceptibility Scores
        • Wildfire Resiliency Score
        • Canadian Wildfire Risk Score + Insights
        • Wildfire Risk Insight Reports
        • Wildfire Risk Mitigation

        • Wildfire Risk Insight Reports
        • Field Insights
        • Active Wildfire Intelligence

        • Overwatch
        • Wildfire Moratorium Insights
  • Resources
    • Brochures
    • White Papers & Case Studies
    • Videos
    • Preferred Vendors
  • News
  • Contact Us
    • Contact Us
    • Support
  • Active Wildfires
  • LinkedIn
  • YouTube
  • LinkedIn
  • YouTube
Active Wildfires
Evergreen forest in the foreground with layers of wildfire haze over mountain ridges fading into a golden sunset.

A $3.7 Billion Summer Puts Canada’s Wildfire Policy Debate on the Underwriting Desk

Green outline of a light bulb with a gear inside it, symbolizing innovation or technical ideas. Radiating lines suggest illumination or creativity spreading rapidly, like a wildfire.
The Quick Read

The Insurance Bureau of Canada (IBC) reported on October 22 that severe weather cost insurers more than $3.7 billion this summer, according to CatIQ estimates, making summer 2026 the third-costliest on record. Wildfires, including intense fires in British Columbia, sat alongside floods and storms in that total.

IBC paired the number with six specific asks of governments, including tighter land-use planning, mitigation incentives, community-level mitigation, updated building codes, and clearer risk information. For personal lines, commercial property and broker teams, the list is an early read on where wildfire policy and data expectations are heading.

How Property Guardian Helps: Our Canadian Wildfire Risk Score + Insights gives underwriters and portfolio teams a consistent, property-level view of wildfire exposure, which is the evidence base that land-use, code and mitigation-credit conversations will increasingly require.

Every few years, a loss number arrives that changes the tone of a policy conversation. This October, the number was $3.7 billion. That is the insured cost of summer 2026 severe weather in Canada, per CatIQ, and it makes this the third-worst summer on record. What stands out is not only the total. It is how specific the industry’s requests of government have become.
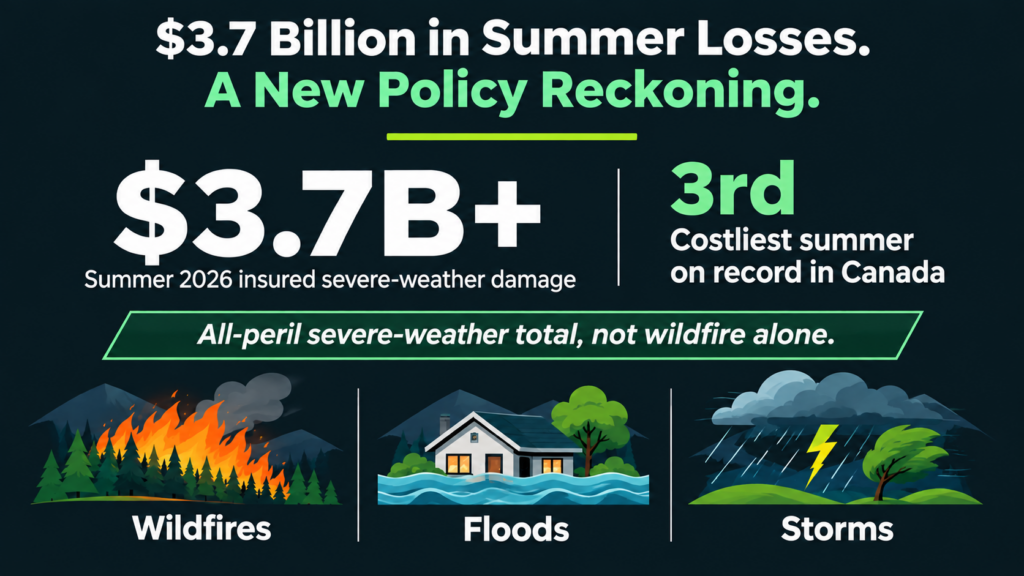
Infographic showing $3.7 billion in Canadian summer 2026 insured damage from severe weather, marking the 3rd costliest on record, with illustrations of wildfire, floods, and storms.
What IBC Actually Asked For

In its October 22 release, IBC called on all orders of government to act on six fronts. The first is to stop building new homes in high-risk flood and wildfire zones by tightening land-use planning and restricting development in the highest-risk areas. The second is to offer incentives for practical, affordable measures that reduce damage and recovery costs. The third is to require cost-effective community-level mitigation where building in high-risk areas cannot be avoided. The fourth is to invest in resilient infrastructure. The fifth is to update building codes so new homes reflect current and future climate conditions. The sixth is to give homeowners, renters and businesses clear information to assess and reduce their own risks.
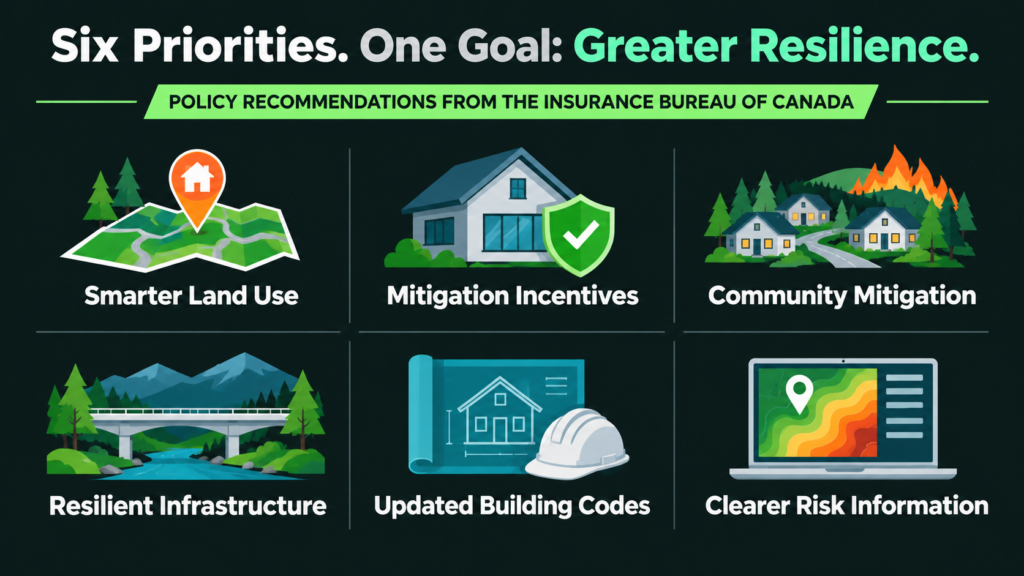
Infographic titled “Six Priorities. One Goal: Greater Resilience” from the Insurance Bureau of Canada, outlining policy recommendations like smarter land use, wildfire mitigation incentives, and resilient infrastructure to improve community safety.

IBC’s President and CEO, Celyeste Power, was direct about the limits of the industry’s role: “we cannot solve this issue on our own.” Insurers can price and pay, but they do not zone land or write codes.

Why the Wildfire Share of This Year’s Losses Is Not the Whole Story

It would be easy to read a $3.7 billion summer as a wildfire-driven loss. It was not, at least not primarily. The 2026 season burned a large area, with reporting in late summer putting the national total above 4.4 million hectares, but much of that burned in northern Ontario and Quebec, where insured property values are low. Ontario’s Thunder Bay 36 fire alone exceeded 300,000 hectares. Morningstar DBRS has noted that major Canadian insurers reported combined ratios below 95% in 2025 and the first quarter of 2026, and that wildfire losses are not causing severe hits to the sector.

The interface events tell a different story about what a bad outcome looks like. The Bald Range fire near Summerland and Peachland damaged or destroyed roughly 150 structures, and CatIQ’s first insured loss estimate is $313 million. That is under half the $720 million from the 2023 Okanagan and Shuswap fires, but it came from a season in which British Columbia burned about 43,000 hectares, well below its 10-year average. A below-average year by area still produced a loss in the hundreds of millions because the fire reached insured homes.
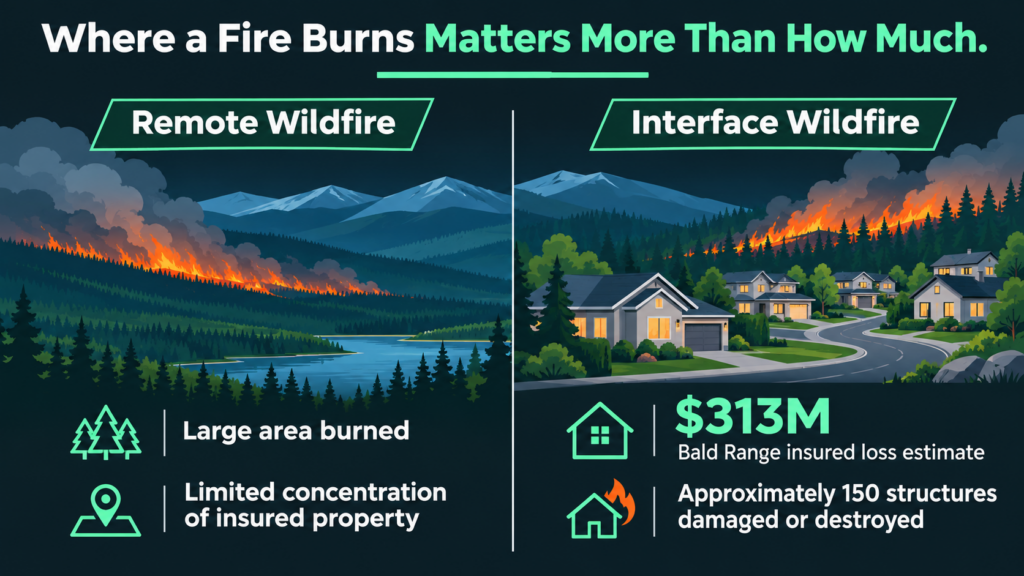
Infographic comparing a remote wildfire to an interface wildfire, illustrating that the latter results in significantly higher insured losses and structural damage.

That is the quiet lesson behind IBC’s asks. Wildfire losses in Canada are less a function of how many hectares burn than of where those hectares sit relative to insured property.

How to Read the Policy Asks

Land-use restrictions, building-code updates and mitigation incentives all share one feature: each needs a way to say which properties and which neighbourhoods are in the highest-risk category, and how much a given improvement reduces that risk. A code change without a view of exposure is a blunt instrument. An incentive without a way to verify the work is hard to fund. A community mitigation requirement without a risk map is hard to target.
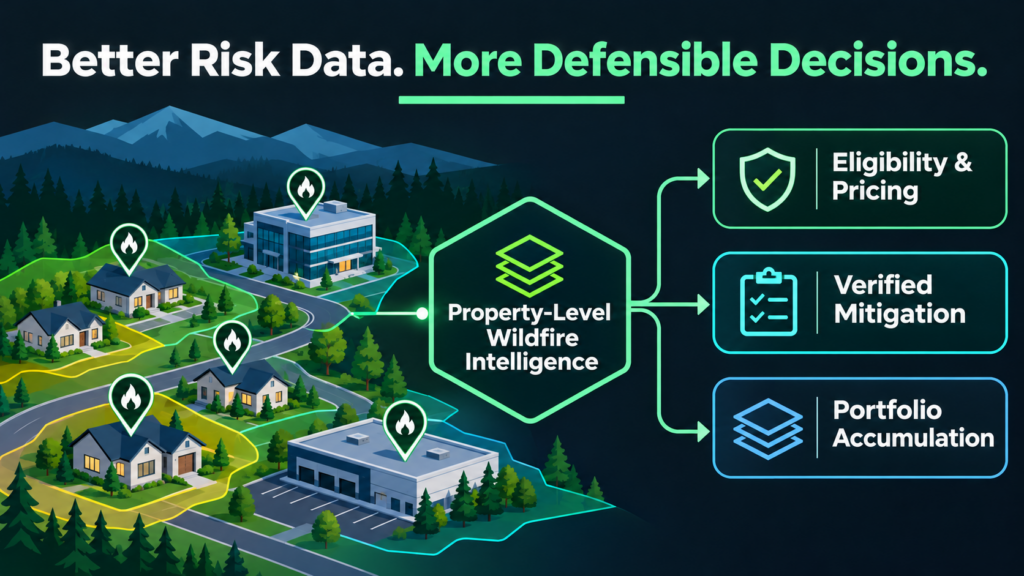
Infographic titled “Better Risk Data. More Defensible Decisions” showing a wildfire risk map connected to three data pillars: Eligibility & Pricing, Verified Mitigation, and Portfolio Accumulation.

For insurers, that points to a likely direction of travel. Regulators, municipalities and reinsurers will increasingly expect carriers to show how they distinguish high-risk from low-risk locations, and to explain how mitigation affects pricing and eligibility. The industry is asking government to act on risk. Government is likely to ask the industry to show its work.

Practical Takeaways
  • Personal lines (homeowner and residential): Product and underwriting leaders should review how wildfire is reflected in territory definitions and eligibility rules. If the policy conversation moves toward incentives for mitigation, carriers that can recognize verified mitigation at the property level will be better placed to participate. Pay particular attention to new-build and rebuild exposure in interface communities, where land-use and code changes will land first.
  • Commercial property and specialty: Schedules with locations in or near wildland-urban interface areas deserve a fresh look at location-level data quality. Codes and land-use rules will vary by province and municipality, so construction and occupancy details matter more, not less.
  • Brokers: Expect clients to ask what mitigation actually earns them. Having a clear answer, and the documentation to support it, will separate a useful broker conversation from a generic one.
  • Reinsurers and corporate risk managers: Watch how provincial and federal responses develop. Policy that reduces new exposure in the highest-risk zones is slow, but it is the kind of structural change that matters to long-run accumulation.
Where Property Guardian Fits

Policy conversations about wildfire are only as good as the evidence underneath them. Property Guardian’s Canadian Wildfire Risk Score + Insights is built for the Canadian market and gives underwriting, portfolio and risk teams a property-level view of wildfire exposure they can use when discussing eligibility, mitigation credit or accumulation with regulators, municipalities, reinsurers and clients. As the policy asks become more specific, so will the need for consistent data behind them.


Sources

Insurance Bureau of Canada, “Fires, floods and storms: $3.7 billion in insured damage makes summer 2026 third worst on record,” October 22, 2026.

Insurance Business Canada, “Canada’s fourth-worst wildfire season has barely dented P&C insurer results,” August 28, 2026.

Property Guardian, “Canada Opens the Door to CAT Bonds for Capital Relief,” October 28, 2026 (Bald Range CatIQ estimate).

Share this post:
Category: Blog
A man with short brown hair and a beard is smiling, wearing a light gray suit with a white shirt and a dark polka dot tie. The background is plain white.

About Brian Bastian

Brian Bastian, Head of Product for Property Guardian, is a seasoned product leader and catastrophe risk management professional with deep expertise in wildfire risk solutions and enterprise SaaS development. As a key driver at Green Shield Risk Solutions, Brian has spearheaded the creation of the Property Guardian platform, delivering cutting-edge tools for superior risk selection, portfolio management, and active loss control. With a foundation built at industry leaders like Guy Carpenter and JLT Re, Brian brings a proven track record of transforming complex risk analytics into actionable insights that enhance resilience and drive value for clients. Passionate about innovation and collaboration, Brian also serves on the board of the International Society of Catastrophe Managers, where he champions technology advancements in catastrophe risk management.

Sidebar

Recent Posts

  • What El Niño Means for US Wildfire Losses
  • A $3.7 Billion Summer Puts Canada’s Wildfire Policy Debate on the Underwriting Desk
  • A Big Fire Year, a Quiet Winter, and a Potentially Historic El Niño: What Commercial Portfolios Should Be Planning For
  • U.S. Wildfire Outlook: November 9th to 22nd, 2026
  • Property Guardian Launches Wildfire Susceptibility Scores: Timing Intelligence for Wildfire Risk at the Property Level

Categories

Stay in the Know!

Stay connected with the Property Guardian team! Subscribe to get the latest updates on product launches, feature enhancements, wildfire news, expert mitigation tips, and much more. Don’t miss out on the insights that matter most!

Our Latest Posts

A hillside view looking down at a suburban neighborhood nestled between forest-covered mountains during a stormy, wildfire-hued sunset.
Category: Blog

What El Niño Means for US Wildfire Losses

Evergreen forest in the foreground with layers of wildfire haze over mountain ridges fading into a golden sunset.
Category: Blog

A $3.7 Billion Summer Puts Canada’s Wildfire Policy Debate on the Underwriting Desk

Aerial view showing a sharp divide between a lush green forest and an area charred by wildfire, providing clear visual analytics of the impact.
Category: Blog

A Big Fire Year, a Quiet Winter, and a Potentially Historic El Niño: What Commercial Portfolios Should Be Planning For

Ready to Get Started?

Let us guide you through a personalized demo and create a customized solution that perfectly aligns with your needs. Protect what matters most with a solution built for you.

contact us

Stay in the Know!

Stay connected with the Property Guardian team! Subscribe to get the latest updates on product launches, feature enhancements, wildfire news, expert mitigation tips, and much more. Don’t miss out on the insights that matter most!

Home

About Us

Our Team

Partners

Contact Us

News

Active Wildfires

All Products

Resources

Brochures

White Papers & Case Studies

Videos

Preferred Vendors

  • LinkedIn
  • YouTube
A green hexagon logo with a shield and cityscape design, next to the text “PROPERTY GUARDIAN” and below it, “A Green Shield Company” on a light gray background.

Headquarters:
2551 N Clark St., Suite 302
Chicago, IL 60614

Copyright © 2026 · Property Guardian · All Rights Reserved · Terms of Use · Privacy Policy· Trust Center

By using this website, you agree to our use of cookies. We use cookies to provide you with a great experience and to help our website run effectively. To find out more, please read our Privacy Policy.