
WILDFIRE RISK ASSESSMENT
Wildfire Susceptibility Scores
Four time-aware wildfire scores, anchored by our patent-pending Recurrence model, built for risk triage and risk optimization. Most hazard scores end where the fire ends — Susceptibility Scores is what comes next.
★ OUR FLAGSHIP DIFFERENTIATOR
The Recurrence Model
The Countdown Other Scores Can’t See
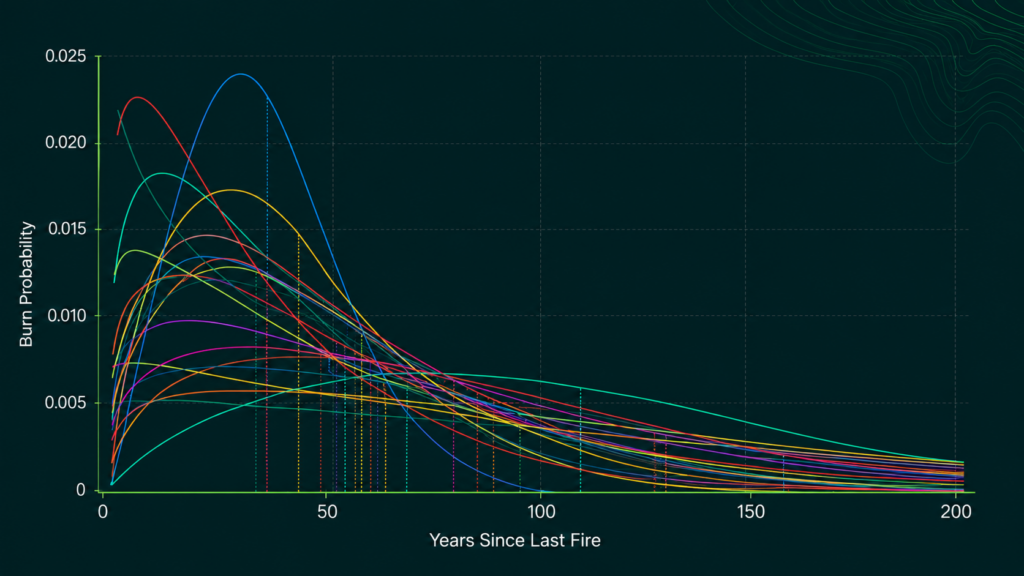
Weather and terrain barely change; fuel does. After a fire, vegetation regrows on a predictable, species-specific clock, and as it rebuilds, the odds of the next burn climb. The same landscapes burn again and again, on a schedule set by their fuel.
Static hazard scores treat a recently burned property as safer. Our Recurrence Risk score treats it as the start of a countdown, estimating how likely a location’s fuels are to burn this year, and how overdue it may be, refreshed on a bi-weekly cycle as new fire activity is confirmed.
- Patent-pending
- Not available from any other wildfire risk provider
WHAT THE MODEL DELIVERS
Four Scores, Four Questions
No single score captures wildfire exposure. Wildfire Susceptibility Scores models four independent dimensions so you can use the lens that fits the decision — read together, they triage risk quickly and defensibly.
HAZARD RISK
How fire-prone is this location overall?
A stable, long-run read of the wildfire risk that fundamentally lives at a location — its underlying fire character, independent of where it sits in the cycle today.
★ RECURRENCE RISK — THE DIFFERENTIATOR
How likely are these fuels to burn this year?
The time-aware, this-year signal — the current readiness of the vegetation here, and its neighbors, to burn. Patent-pending, and built on 125 years of fire history.
LOCAL WILDFIRE LANDSCAPE
Is the surrounding neighborhood a wildfire zone?
Flags fire-active surroundings even when the parcel itself hasn’t burned — the wildfire equivalent of a flood zone.
PROXIMITY TO WILDFIRE FUELS
How close is this to high-risk wildlands?
A “distance to the fire front” signal measuring how near a location sits to the nearest high-susceptibility area.
GO BEYOND HAZARD MAPS
Cost-Effective Exposure Signals
A clear path to double click when needed
Updated on a bi-weekly cycle, Wildfire Susceptibility Scores forecasts wildfire likelihood and timing to help teams make faster, more consistent decisions without relying on static hazard layers. It’s designed around two core workflows — one for high-throughput underwriting triage, and one for time-informed portfolio and policy optimization.

Susceptibility Scores
for Risk Triage
- Scalable underwriting triage: First-pass filter across all four scores to prioritize submissions and reduce manual review time
- Cost-efficient risk allocation: Reserve deeper analysis, like Resiliency and Risk Insight Reports, for the properties that truly warrant it
- Profitable wildfire growth: Strong alignment between Recurrence Risk and real activity supports confident appetite expansion

Susceptibility Scores
for Risk Optimization
- Time-informed policy decisions: Term length, renewal cadence, and binding timing driven by the Recurrence model, our flagship timing signal
- Smarter portfolio growth & rebalancing: Identify where to grow, maintain, or reduce exposure using Hazard, Recurrence, and landscape signals together
- Deeper risk dynamics: Move beyond severity snapshots to understand not just where fire risk lives, but when it’s most likely to strike
Susceptibility Scores by the Numbers
uniform land units analyzed nationwide — all 50 states, including Hawaii and Alaska
of wildfire history incorporated (1900-2025)
fuel classes behind the patent-pending Recurrence model
refresh cycle to account for new wildfire activity
DELIVERY
Fast Delivery, Built Around How You Work
Wildfire Susceptibility Scores fits into your workflow at the point of quote, alongside your other risk tools, or across your entire book.
API
Full system integration with all four scores returned on every quote, built to scale with your submission volume. Typically licensed for unlimited use.
Best for: Triage at scale, wherever quoting already happens.
Portfolio-Wide Analysis
Supports aggregate management of the full portfolio, identifying areas of geographic concentration that may also be overdue for a wildfire event.
Best for: Portfolio managers monitoring accumulation and renewal strategy.
★ PROPERTY GUARDIAN DIRECT
See Exposure and Resiliency Side By Side
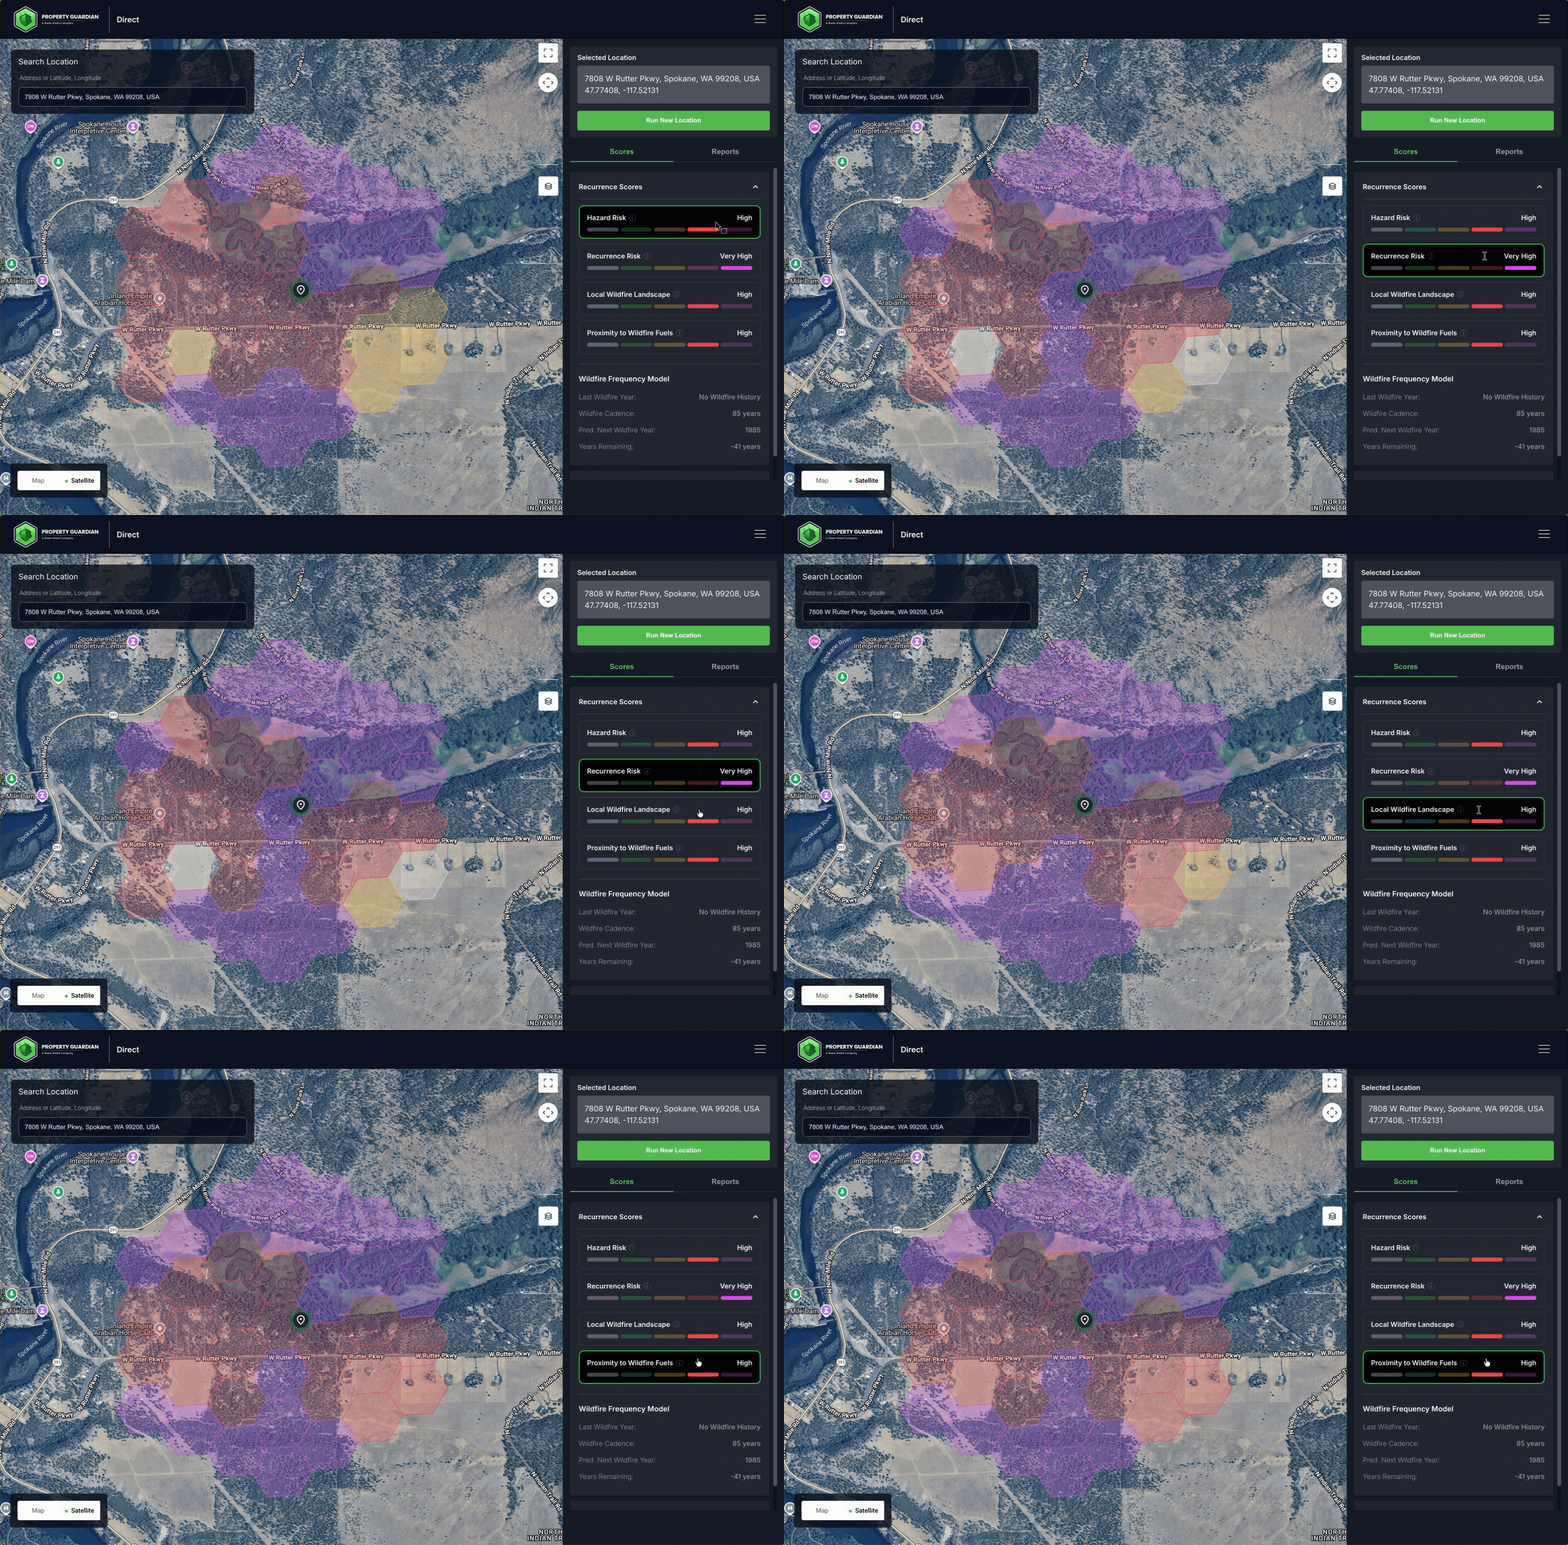
Viewed alongside Resiliency Score and Risk Insight Reports directly in the Property Guardian Direct platform, helping underwriters visualize a property’s surrounding wildfire exposure next to its structural resiliency, without leaving their workflow.
Best for: Higher-value and specialty lines property risks that warrant a closer look.
Ready to strengthen your wildfire underwriting strategy?
Contact us to learn how Wildfire Susceptibility Scores, anchored by our patent-pending Recurrence model, can integrate into your risk selection and pricing workflows.