
• Skip to main content
  • Skip to header right navigation
  • Skip to site footer
A green hexagon logo with a shield and cityscape design, next to the text “PROPERTY GUARDIAN” and below it, “A Green Shield Company” on a light gray background.

Property Guardian

  • About Us
    • About Us
    • Our Team
    • Our Partners
    • Preferred Vendors
  • Solutions
        • Underwriting

        • Large Commercial Property
        • Specialty Lines
        • High-Volume & Transactional Property
        • Ultra-High Net Worth Homeowners
        • Loss Control & Risk Management

        • Loss Control Teams
        • Insurance Brokers
        • Corporate Risk Management
        • Wildfire Risk Mitigation & Response Vendors
        • Property Inspection Companies
        • CAT Modeling & Reinsurance
  • Products
        • Wildfire Risk Assessment

        • Wildfire Recurrence Scores
        • Wildfire Resiliency Score
        • Canadian Wildfire Risk Score + Insights
        • Wildfire Risk Insight Reports
        • Wildfire Risk Mitigation

        • Wildfire Risk Insight Reports
        • Field Insights
        • Active Wildfire Intelligence

        • Overwatch
        • Wildfire Moratorium Insights
  • Resources
    • Brochures
    • White Papers & Case Studies
    • Videos
  • News
  • Contact Us
    • Contact Us
    • Support
  • Active Wildfires
  • LinkedIn
  • YouTube
  • LinkedIn
  • YouTube
Active Wildfires
Coming Soon

Canadian Wildfire Risk Score + Insights

Physics-based, property-level wildfire risk intelligence built for the Canadian Wildland-Urban Interface (WUI) — where the structures you insure actually sit. Every score is explainable, every driver is defensible.

Get Early Preview

Decision-Grade Wildfire Risk Scoring

No Black Box. Built for Underwriting.

Property Guardian’s Canadian Wildfire Risk Score + Insights deliver underwriting-grade, property-level wildfire risk scoring for profitable decisions.

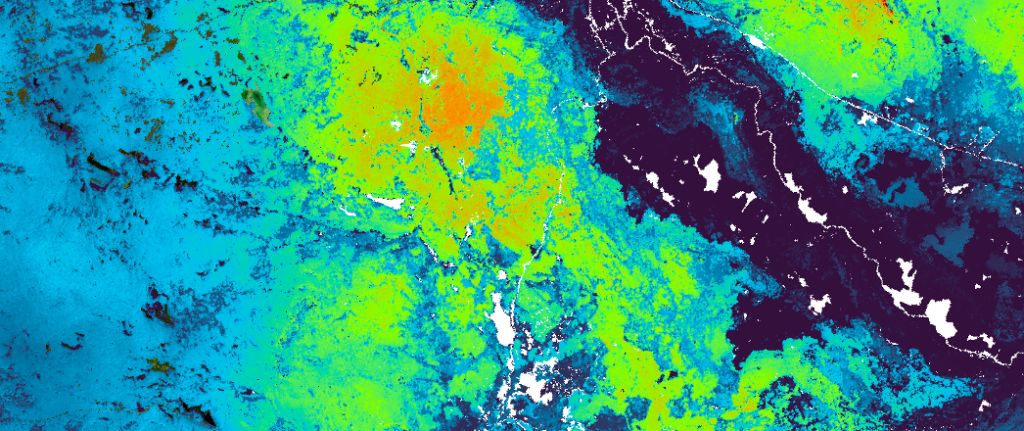
Developed in partnership with ApexRMS, the product combines Canadian wildfire science with insurance-ready modeling. It is built on a 30-metre national fuels dataset, refreshed annually for burn scars, fuel growth, and land-use change, and runs 15,000+ Monte Carlo simulations per hex cell to model burn probability, fire intensity, and rate of spread.

The result: a peer-reviewed, patent-pending methodology that is explainable, defensible, and purpose-built for Canadian insurance.
Colorful abstract satellite map featuring bright blue, green, yellow, and orange tones with dark purple areas, representing elevation or vegetation. White lines and patches suggest rivers, roads, or city boundaries.

Where Traditional Models Fall Short

The Risks You Insure Exist in the Wildland-Urban Interface (WUI)

Most wildfire models were built for wildland and forestry management, not to underwrite structures in the Canadian WUI. Generic models optimise for open-forest spread and miss exactly the elements that drive insured loss.
A green, simplified icon of a house with stylized flames on the roof and side, representing a house on fire. The background is white.
Built for Wildland, Not the WUI

Generic models focus on open-forest spread, not where insured structures meet fuel

A simple green icon depicting two pine trees and one leafy tree with stylized grass at the bottom, all on a white background.
Limited by Stale Fuel Data

Old or incomplete fuels data can distort a key driver of wildfire behavior

A green eye icon with a diagonal line crossing through it, symbolizing "hidden" or "not visible," on a light gray background.
Too Coarse for Underwriting

Low-resolution models miss property-level differences that matter

Three green puzzle pieces fit together, with one missing piece, and a green question mark surrounded by lines above the gap, symbolizing a mystery or solution yet to be found.
Missing Critical Risk Drivers

Suppression difficulty, ember exposure, and conflagration risk are often left out

A Peek Behind the Score

Our Canadian Wildfire Risk Score + Insights include the community- and property-level factors generic models miss — exactly what makes risk legible in the Canadian WUI. Below are a few of the major factors we include.
Hexagonal grid map showing varying concentrations of red, orange, and yellow, indicating intensity or density. Green patches and a large black area suggest land and water or low-density regions.
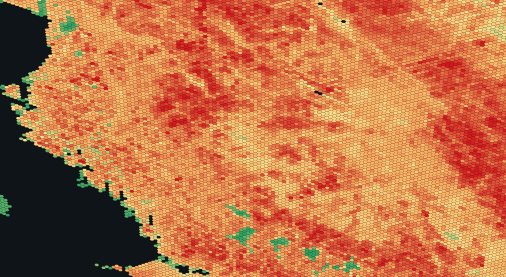
Suppression Effort

How challenging suppression would be at a location — supports protection-class evaluation.
A false-color heat map image showing a gradient from blue on the left to bright orange and yellow on the right, representing temperature or elevation variations across a textured landscape.
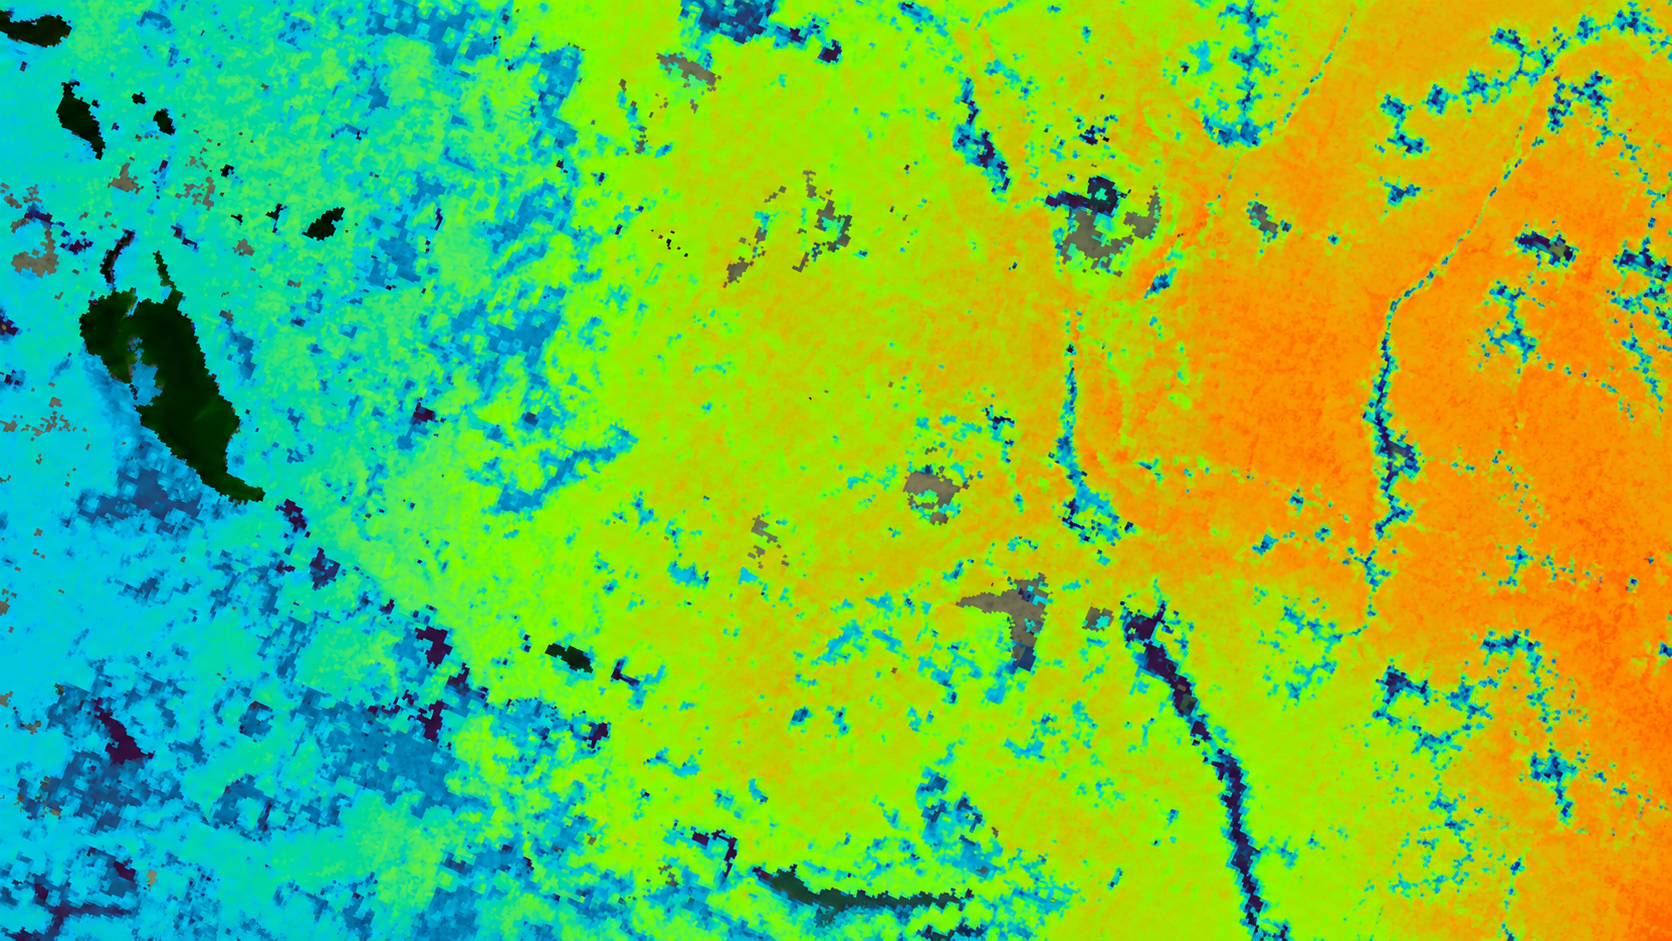
Burn Probability

Understand not just whether a property sits in wildfire territory, but how likely it is to actually burn.
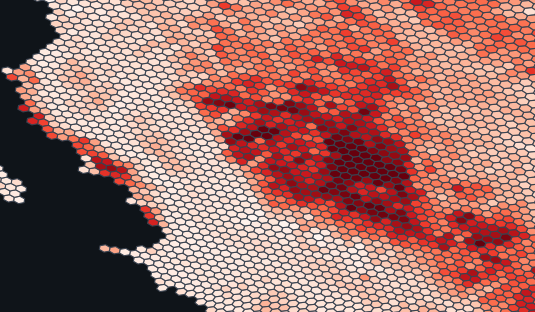
A hexagonal grid map with cells shaded from light pink to dark red, indicating varying data density. Darker red clusters are concentrated in the center-right, while the left side has mostly lighter cells and a black area.
Wildfire Recurrence

How frequently wildfire occurs in the area, including vegetation regrowth cycles.
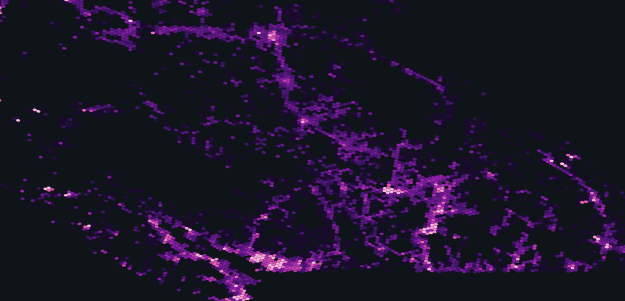
A dark map with scattered purple and pink glowing dots and lines, forming illuminated patterns that resemble streets or networks across the area.
Urban Conflagration

Potential for large-scale fire growth — methodology proven in our U.S. model.
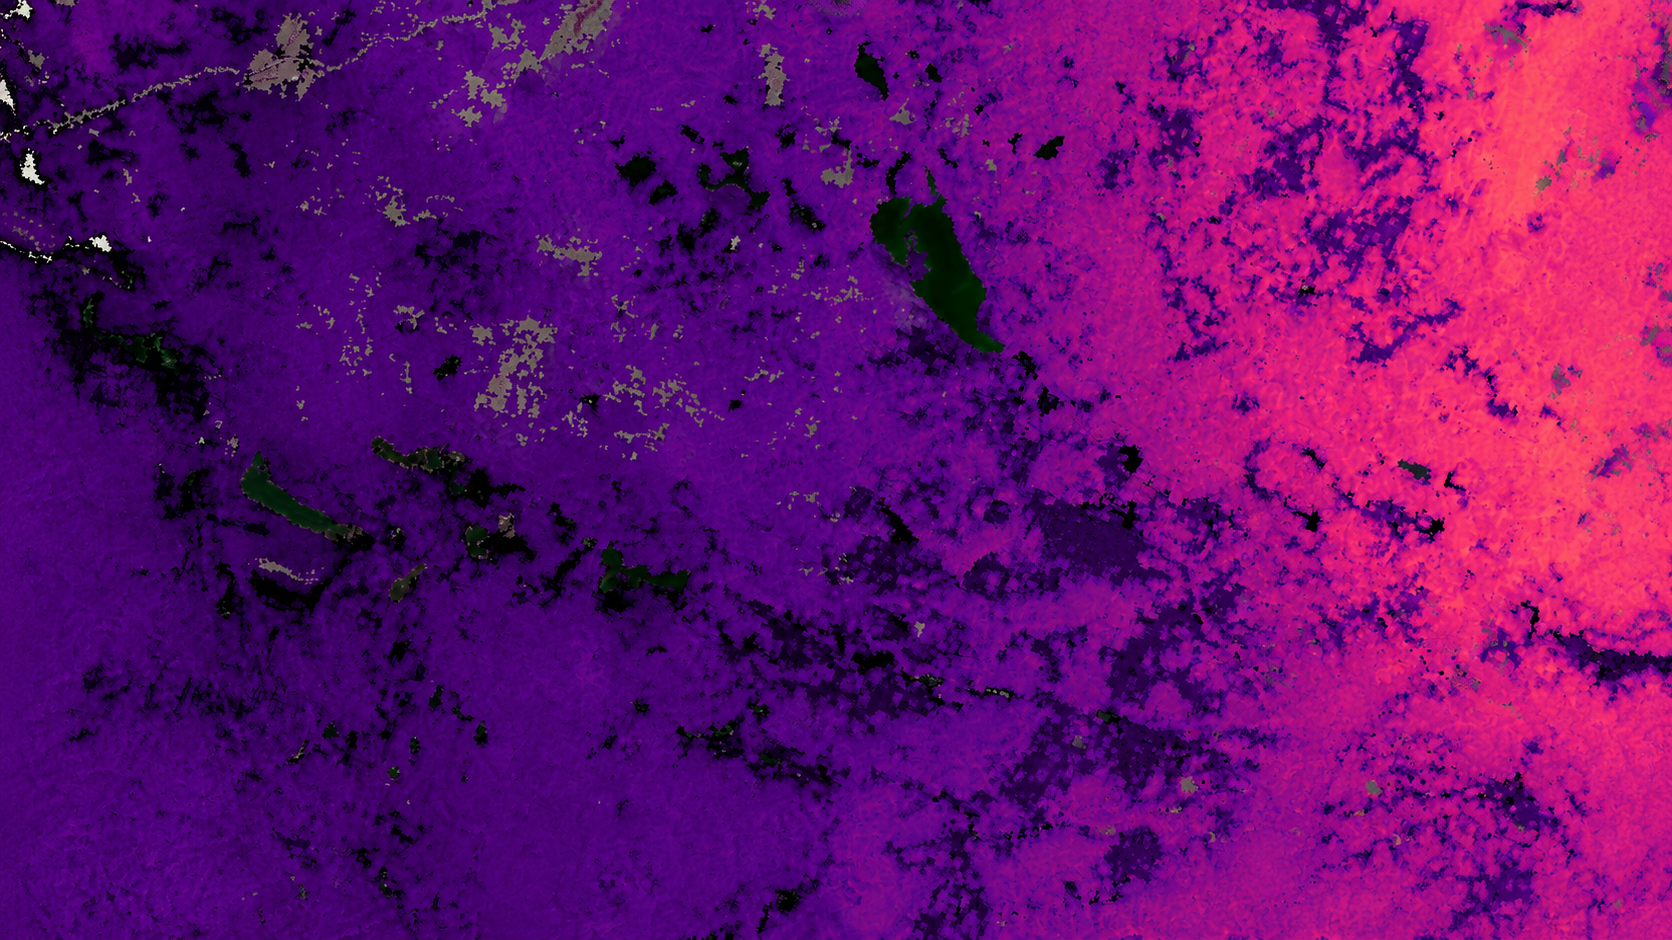
Satellite image with vibrant purple, pink, and orange hues, interspersed with dark green patches representing bodies of water and vegetation. The colors illustrate varied terrain or vegetation density.
Fire Intensity

Understand not just where fire may occur, but how destructively it could burn.
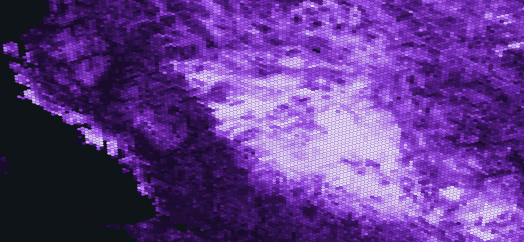
A pixelated, abstract image in shades of purple, with a bright white area in the center and darker purple and black regions surrounding it, resembling a heatmap or digital mosaic pattern.
Ember Exposure

Downwind ember transport and spot-fire exposure beyond the fire perimeter.

One Score, Every Risk Driver
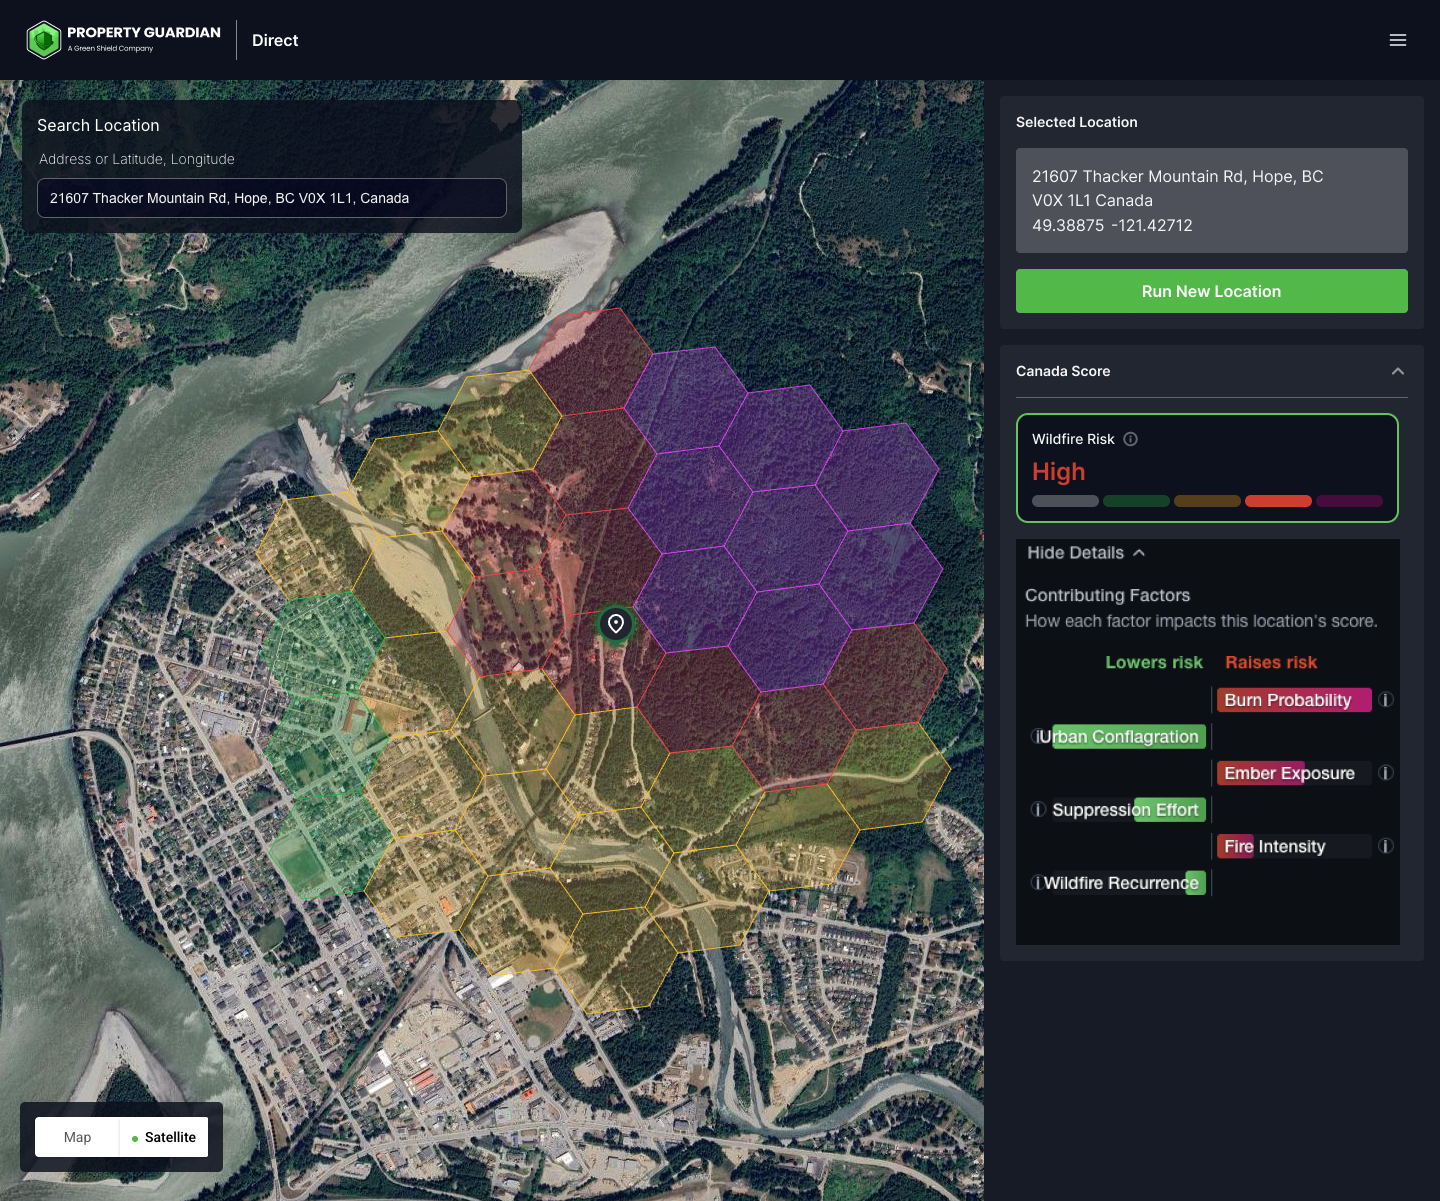
A satellite map interface shows color-coded hexagons indicating wildfire risk levels around 21907 Thacker Mountain Rd, Hope, BC. A sidebar displays a "High" wildfire risk score with contributing factors listed.

Beyond the composite 0–100 score, every property receives a breakdown of contributing risk drivers, each flagged as raising or lowering risk relative to baseline. Underwriters see not just the score, but why.

Each driver is delivered alongside the composite score, giving underwriters a defensible, explainable basis for every decision.

Pull just the signals you need to enrich an existing pricing or underwriting model. No rip-and-replace required. Drop any single driver into the score or model you already run.

Get Sneak Peek

Built for the Decisions that Matter Most

Purpose-built wildfire intelligence that helps insurance leaders underwrite with confidence, manage accumulation, and support growth in exposed regions.

Underwriting Leaders

  • Sharpen risk selection in wildfire-exposed regions
  • Improve property-level segmentation and pricing
  • Support decisions with explainable risk factors

Portfolio & Risk Leaders

  • Gain portfolio-wide wildfire accumulation visibility
  • Strengthen appetite and capacity management
  • Align underwriting insights with ERM views

Product & Strategy Leaders

  • Enable growth in challenging wildfire markets
  • Reduce reliance on blunt geographic controls
  • Improve defensibility with regulators and reinsurers

Flexible Delivery. Multiple Output Options.

A green gear icon with a white circle in the center containing a pair of angle brackets and a forward slash, representing coding or programming.
API Integration

Real-time wildfire risk intelligence embedded directly into underwriting and loss control workflows

A green icon of a web browser window with three circles in the top left corner and a white arrow cursor in the center.
Property Guardian Direct

Instant property-level wildfire risk screening for fast, consistent underwriting and loss control decisions.

Green icon showing a web browser window with a chart, upward arrow, and bar graph. A magnifying glass with a checkmark and a document are also included, representing data analysis and review.
Bulk Analysis Services

Portfolio-wide wildfire risk analysis to support accumulation management, appetite setting, and strategic planning.

Canadian Wildfire Risk Score + Insights

Our Canadian Wildfire Risk Score + Insights is coming soon — we’re currently finalizing model calibration and validation. If you’d like an early preview, connect with us today.

A person wearing a plaid shirt uses a tablet near a window. The individual's face is not visible, focusing on their hands interacting with the device. Soft natural light illuminates the scene.

Our Latest Posts

A ferocious wildfire spreads through a dense forest, engulfing trees and ground in bright orange flames, with smoke rising into the air and sunlight filtering through the trees.
Category: Active Wildfires

Weekly U.S. Wildfire Outlook: Week of July 27, 2026 

Modern building with large windows sits empty in a dry, grassy landscape, an area prone to wildfire, with mountains and pine trees in the background under a clear blue sky at sunset.
Category: Blog

Capital Is Coming Back to Wildfire Risk: What the Catastrophe Bond Boom Means for Commercial Property Teams

A modern building sits near a mountain landscape, while thick smoke and flames from a raging wildfire rise in the distance under a dramatic, cloudy sky.
Category: Blog

Colorado Wildfire Resiliency Code Is Now Live: Why Commercial Property Teams Should Read It as an Underwriting Signal

Stay in the Know!

Stay connected with the Property Guardian team! Subscribe to get the latest updates on product launches, feature enhancements, wildfire news, expert mitigation tips, and much more. Don’t miss out on the insights that matter most!

Home

About Us

Our Team

Partners

Request a Demo

Contact Us

Property Guardian InsurAble

All Products

Resources

Brochures

White Papers & Case Studies

Videos

  • LinkedIn
  • YouTube
A green hexagon logo with a shield and cityscape design, next to the text “PROPERTY GUARDIAN” and below it, “A Green Shield Company” on a light gray background.

Headquarters:
2551 N Clark St., Suite 302
Chicago, IL 60614

Copyright © 2026 · Property Guardian · All Rights Reserved · Terms of Use · Privacy Policy· Trust Center

By using this website, you agree to our use of cookies. We use cookies to provide you with a great experience and to help our website run effectively. To find out more, please read our Privacy Policy.