

The Quick Read
A new report from UL Research Institutes, built on a 2026 exercise involving about 20 organizations from academia, government, national laboratories, nonprofits and the private sector, tested a range of wildfire risk models against common scenarios and datasets. Its central finding is direct: no single model can capture the full complexity of wildfire risk.
For commercial property teams, the takeaway is practical. A hazard score by itself leaves a gap between what a model outputs and what underwriters and risk managers must decide: what is exposed, why it is vulnerable, and which actions reduce loss most. The report points toward ensemble modeling, shared data standards and greater model transparency.
How Property Guardian Helps: Property Guardian’s wildfire risk insight reports give underwriting and risk teams a property-level view designed to sit beside existing catastrophe models, adding context on fire behavior and mitigation that a single score cannot.
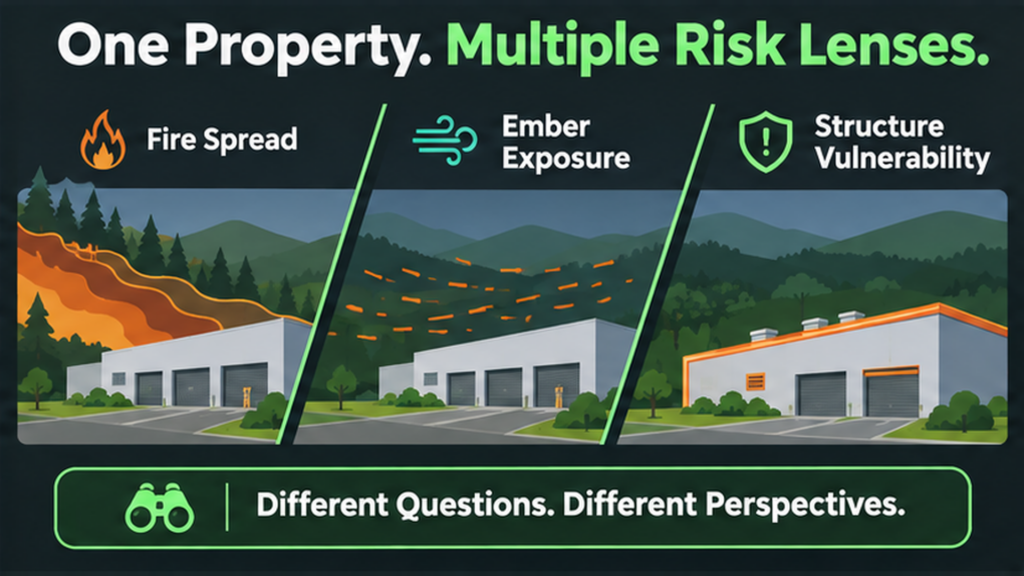
Ask three wildfire models about the same warehouse and you may get three different answers. That is not necessarily a flaw in the models. It is a feature of the problem, and a new report from UL Research Institutes puts that reality on the record.
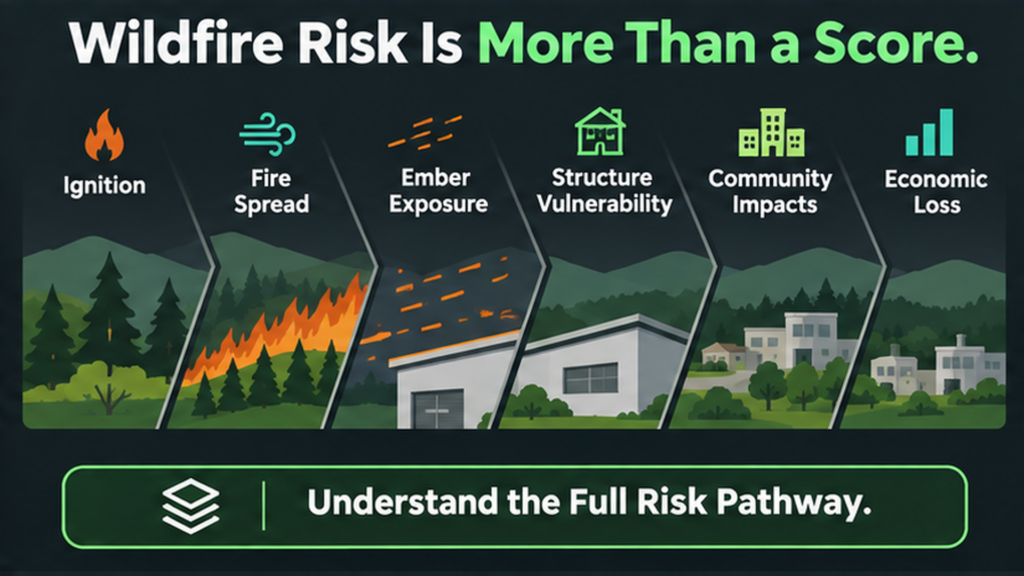
Wildfire risk is not one thing. It is the chance a fire ignites, how it spreads, whether embers reach a structure, whether that structure ignites, how quickly responders can act, and what the resulting loss costs. Most tools answer one or two of those questions well. Commercial property teams are asked to price and manage all of them at once.
What the Exercise Tested
The 2026 Wildfire Risk Modeling Exercise brought together about 20 organizations from academia, government, national laboratories, nonprofits and the private sector. Participants ran a range of wildfire risk models against common scenarios and shared datasets. Holding the inputs constant allows a side-by-side look at how different approaches behave and where they diverge.
UL Research Institutes released a report this month that distills the exercise and lays out a roadmap for what it calls next-generation wildfire risk intelligence. Fire Engineering covered the release on November 4. One caution on sourcing: the coverage we reviewed does not report quantitative results from the exercise, so this post focuses on the report’s conclusions and recommendations rather than model-by-model performance.
What the Report Found
The headline conclusion is that no single model can capture the full complexity of wildfire risk, and that models should be combined rather than relied on alone. That is a notable statement from a collaboration this broad, because it comes from the people who build and run these tools.
The report also identifies a second gap. Current tools are good at describing hazard, but there is a distance between hazard and what matters to communities and decision-makers: who and what is at risk, why they are vulnerable, and which actions would reduce risk most. In insurance terms, that is the distance between a score and a decision.
The recommendations follow from those findings. The report calls for an interoperable modeling ecosystem that covers the full risk pathway, from ignition and fire spread through structure exposure, community impacts and economic consequences. It asks for stronger shared core data and standards, improved transparency and explainability, expanded decision-support tools for fire service and emergency management users, and greater use of ensemble modeling.
Why This Matters to Commercial Property Teams
Commercial portfolios rarely look like a single risk. A schedule may include distribution centers, multifamily assets, manufacturing sites and retail, each with different construction, occupancy, vegetation and access. A model tuned to answer one question about one type of asset can be misleading when applied uniformly.
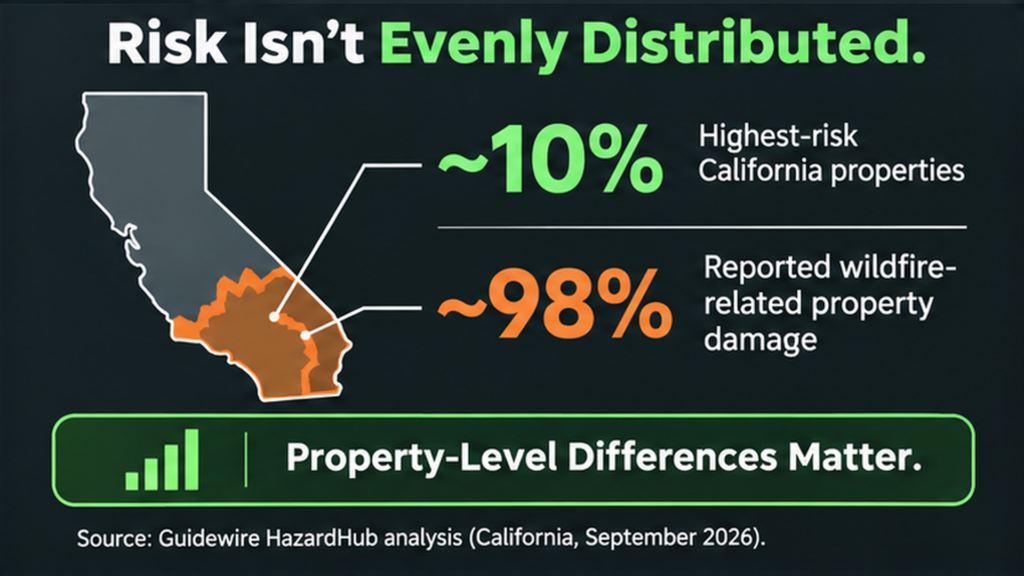
The finer the question, the more the differences matter. Guidewire HazardHub analysis released in September and reported by Carrier Management in early October found that about 98% of wildfire-related property damage in California occurs within roughly 10% of the state’s highest-risk properties. Its authors argued that broad regional assumptions overlook meaningful differences between neighboring properties. If that concentration holds, then the choice of model, and the way multiple models are reconciled, directly shapes where capacity is deployed and how it is priced.
Transparency matters as well. Underwriters, brokers, reinsurers and regulators increasingly want to know why a score is what it is. A report that explicitly names explainability as a priority reinforces a direction the market is already moving. Teams that can describe what each model includes, what it leaves out, and how they weigh the difference will have a stronger position in rate discussions, reinsurance submissions and broker conversations.
Practical Takeaways for Underwriters, Risk Managers & Property Operators
- Treat model output as a range, not a single number. When two sources disagree on a location, document why. The disagreement is information about uncertainty, and it belongs in the file.
- Ask each vendor what the model represents. Does it cover ignition, spread, ember exposure, structure vulnerability and loss, or only some of those? Knowing the boundaries of each tool tells you where a second lens adds value.
- Anchor mitigation discussions in property-level evidence. The same HazardHub work, drawing on about 91,800 California home inspections, found that well-maintained defensible space was associated with a 65% lower likelihood of significant wildfire damage, and ember-resistant vents with a 40% lower likelihood of ignition. Those figures come from residential inspections, so apply them to commercial assets with care, but the direction supports documenting what has been done at each site.
- Tighten your own data. Ensemble approaches only work when the underlying inputs are consistent. Accurate construction details, occupancy, valuation and geocoding improve every model you use.
- Translate scores into actions. For property operators, the most useful output is a short list of what to fix first. Ask your insurer or broker which actions would most improve a location’s profile, and keep records of completed work.
Where Property Guardian Fits
The UL findings describe the environment Property Guardian was built for: a market that needs more than one lens. Our wildfire risk insight reports provide a property-level view that can sit alongside the models your team already uses, with added context on fire behavior around each location.
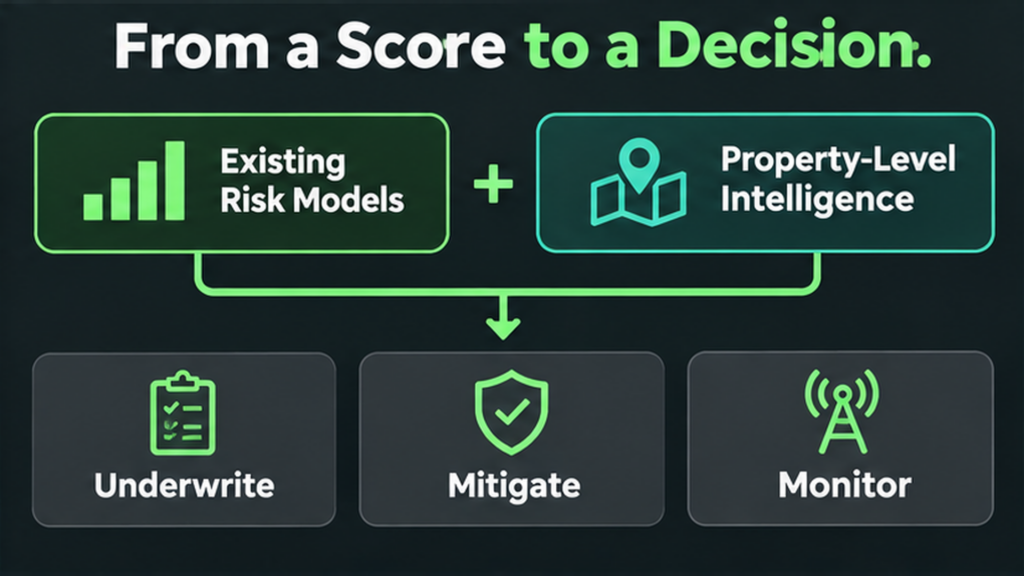
When mitigation is the question, our mitigation services help teams identify and prioritize actions. When a fire is burning, our active fire intelligence helps teams understand what is happening near their schedule. Together, they help move a team from a score to a decision.
Sources
Carrier Management, Guidewire HazardHub analysis, October 2, 2026.
