


• Skip to main content
  • Skip to header right navigation
  • Skip to site footer
Property Guardian

Property Guardian

  • About Us
    • About Us
    • Our Team
    • Our Partners
  • Solutions
        • Underwriting

        • Large Commercial Property
        • Specialty Lines
        • High-Volume & Transactional Property
        • Ultra-High Net Worth Homeowners
        • Loss Control & Risk Management

        • Loss Control Teams
        • Insurance Brokers
        • Corporate Risk Management
        • Wildfire Risk Mitigation & Response Vendors
        • Property Inspection Companies
        • CAT Modeling & Reinsurance
  • Products
        • Wildfire Risk Assessment

        • Wildfire Susceptibility Scores
        • Wildfire Resiliency Score
        • Canadian Wildfire Risk Score + Insights
        • Wildfire Risk Insight Reports
        • Wildfire Risk Mitigation

        • Wildfire Risk Insight Reports
        • Field Insights
        • Active Wildfire Intelligence

        • Overwatch
        • Wildfire Moratorium Insights
  • Resources
    • Brochures
    • White Papers & Case Studies
    • Videos
    • Preferred Vendors
  • News
  • Contact Us
    • Contact Us
    • Support
  • Active Wildfires
  • LinkedIn
  • YouTube
  • LinkedIn
  • YouTube
Active Wildfires
A hillside view looking down at a suburban neighborhood nestled between forest-covered mountains during a stormy, wildfire-hued sunset.

What El Niño Means for US Wildfire Losses

A strong El Niño is coming. What does it mean for wildfire losses?

Green outline of a light bulb with a gear inside it, symbolizing innovation or technical ideas. Radiating lines suggest illumination or creativity spreading rapidly, like a wildfire.
The Quick Read

A potentially historic El Niño is taking shape, and new research from KatRisk shows how it could reshape U.S. wildfire losses heading into 2027. In El Niño-leaning years, modeled average annual wildfire losses decline across much of the South, including approximately 21% in Texas, 20% in Georgia and 15% in Florida. The pattern reverses across parts of the northern U.S., where expected losses increase. A subsequent shift toward La Niña could reverse those trends.

But lower average losses do not eliminate the potential for major wildfires. Wet El Niño winters can accelerate grass and fine-fuel growth, creating additional exposure as vegetation dries. For underwriters, reinsurers and portfolio managers, the challenge is understanding how these shifting regional trends affect both near-term exposure and risk heading into 2027-28.

How Property Guardian Helps: Property Guardian complements KatRisk’s portfolio-level modeling with Wildfire Susceptibility Scores that assess property-level Hazard and Recurrence Risk, while Overwatch monitors active wildfire threats. Together, they help insurers translate shifting regional trends into more informed underwriting and risk decisions.

Our partners at KatRisk just published one of the clearest looks we have seen at how the El Niño–Southern Oscillation (ENSO) moves US wildfire loss: El Niño Watch: How ENSO Shifts U.S. Wildfire Losses. It is required reading for anyone pricing, accumulating or reinsuring wildfire exposure heading into 2027.

The timing matters. NOAA’s Climate Prediction Center put the odds at 83% that this fall’s event will be stronger than any El Niño on record since 1950. KatRisk used its stochastic wildfire model to ask what that tilt does to average annual loss (AAL), state by state and county by county. Below, we summarize what they found and share how we think about it at Property Guardian.

What KatRisk Found

KatRisk split its stochastic wildfire catalog by ENSO phase in each simulated year, then compared El Niño-leaning and La Niña-leaning years against the full-catalog baseline. The headline is a north-south split that runs in opposite directions.
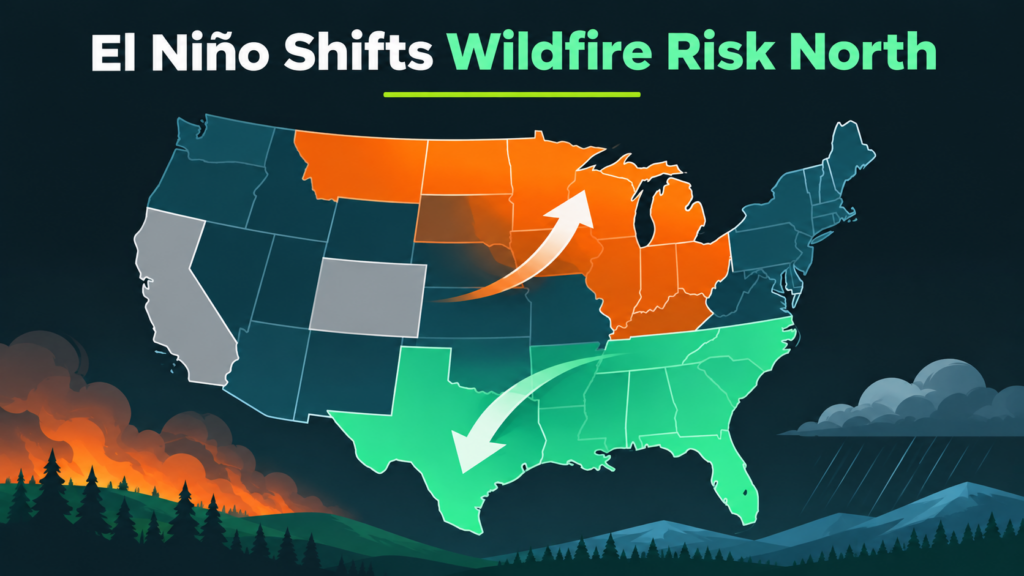
Map of the United States showing El Niño shifting wildfire risk from the southern states to the upper Midwest, illustrated by an upward-pointing arrow over orange-shaded states and a downward-pointing arrow over green-shaded states.
  • The South gets relief under El Niño. AAL drops across most of the southern tier, from California and the Desert Southwest through Texas, the Gulf Coast and Florida. La Niña flips it almost exactly.
  • The North moves the other way. El Niño raises AAL in Montana, North Dakota, Minnesota, Wisconsin, Michigan and the Ohio Valley.
  • The West is more muted. California and Colorado shift less, and KatRisk notes that Santa Ana and Diablo winds remain bigger drivers of the Western season.
  • The tail shifts too. Years exceeding the 10-year return period loss fall from 10% overall to 8.6% in El Niño-leaning years, and rise to 11% in La Niña-leaning years.
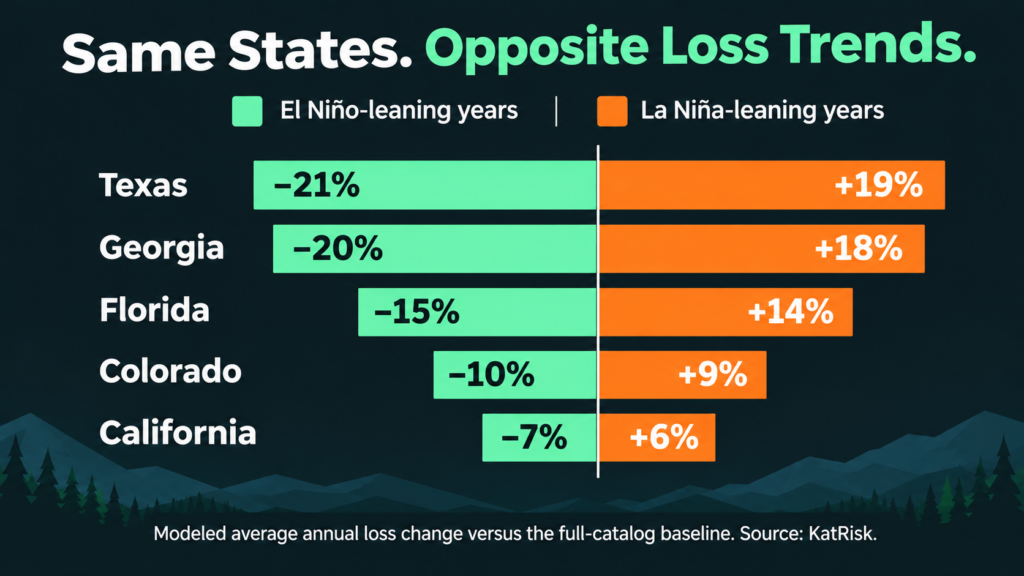
Bar chart comparing annual wildfire loss changes for Texas, Georgia, Florida, Colorado, and California during El Niño-leaning versus La Niña-leaning years, showing opposite percentage trends for each state.

Two cautions in the piece deserve the most attention. First, as KatRisk puts it, “A lower average does not mean a season without major fires.” Second, the delayed fuel effect: a wet El Niño winter grows grasses and fine fuels that cure later. Strong El Niño events are often followed by La Niña, the higher-loss phase for much of the South and West, which makes 2027–28 a season to watch. KatRisk sums it up well: “ENSO shifts the odds; it does not set the outcome.”

Why This Matters for Underwriters and Portfolio Managers

KatRisk’s work answers a portfolio question: how does the expected loss of a book shift when the climate signal tilts one way or the other? That is exactly the lens reinsurers, cat modelers and capital teams need for 2027 planning.

A few practical takeaways we are discussing with our clients:

  • Don’t treat southern relief as a pricing holiday. A lower average still allows a large event, and the fuel crop from a wet winter can carry risk forward into the next season.
  • Revisit northern exposure. Books concentrated in the Upper Midwest and Ohio Valley may not usually top wildfire watch lists, but El Niño pushes their expected loss up.
  • Plan two seasons ahead. If La Niña follows, the 2027–28 picture across the South and West could look very different from this winter’s.
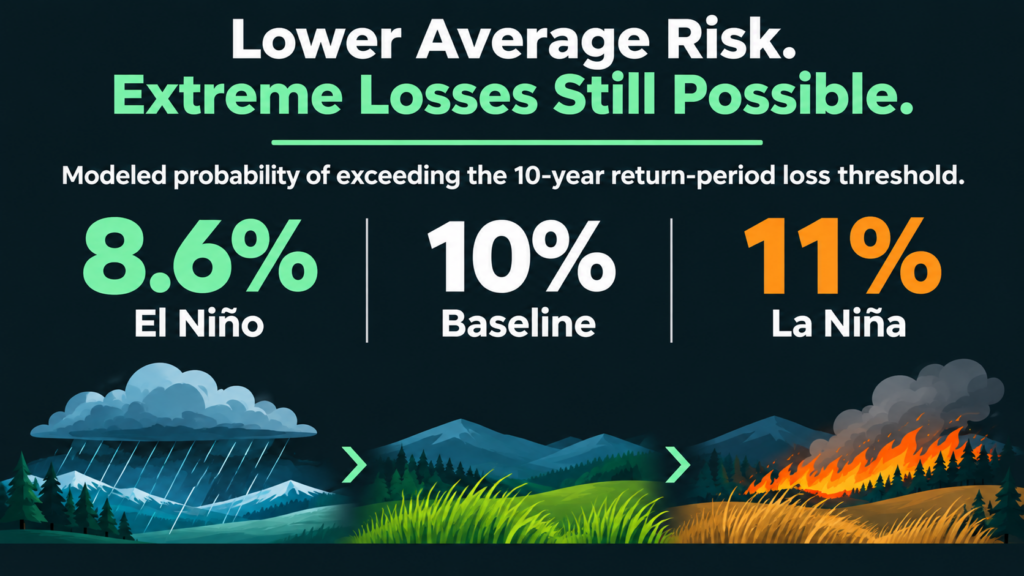
Infographic showing the modeled probability of exceeding the 10-year return-period wildfire loss threshold: 8.6% for El Niño, 10% for Baseline, and 11% for La Niña, illustrated with icons of rain, grass, and wildfire.
Where Property-Level Data Fits

A state-level shift of 15 or 20% tells you which way the wind is blowing for the portfolio. It doesn’t tell you which properties inside that state are carrying the risk. That is where KatRisk’s catastrophe model view and Property Guardian’s property-level wildfire intelligence work together.
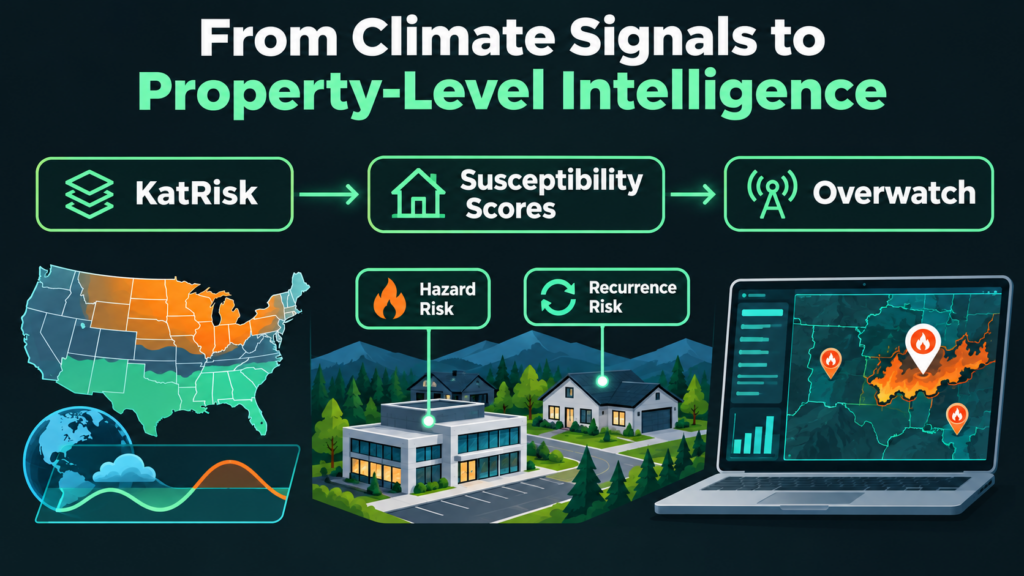
Infographic titled “From Climate Signals to Property-Level Intelligence” showing a workflow from KatRisk to wildfire susceptibility scores and Overwatch, featuring a map, property icons, and a dashboard displaying fire hazard and recurrence risks.
  • Wildfire Susceptibility Scores pair Hazard Risk with Recurrence Risk, a timing view of how long it has been since an area last burned relative to its fire history. Perimeter history refreshes every two weeks, so the frequency clock resets as fires happen. That helps underwriters separate risks that are far from due from those that are overdue, even inside a region where ENSO is lowering the average.
  • Overwatch monitors active fires against client portfolios in real time, which matters most in exactly the scenario KatRisk flags: a below-average year that still produces a major event.

KatRisk’s account teams already position Susceptibility Scores alongside their catastrophe model outputs. ENSO is a good example of why the combination works: the model sets the portfolio-level expectation, and property-level data helps you act on it one risk at a time.

The Bottom Line

El Niño tilts the odds toward a quieter southern season and a busier northern one, but it doesn’t take a costly wildfire year off the table. We encourage everyone to read the full KatRisk article, including its state and county maps, and to reach out to the KatRisk team about their wildfire model.

To see how Wildfire Susceptibility Scores and Overwatch can sharpen your view of the 2027 season at the property level, contact the Property Guardian team.


Sources

KatRisk, El Niño Watch: How ENSO Shifts U.S. Wildfire Losses

KatRisk, Wildfire model and catastrophe models

NOAA Climate Prediction Center, ENSO Diagnostic Discussion

NOAA, El Niño looms large over U.S. Winter Outlook

Cardil, A., et al. (2023), Climate teleconnections modulate global burned area, Nature Communications

Share this post:
Category: Blog
A man with short brown hair and a beard is smiling, wearing a light gray suit with a white shirt and a dark polka dot tie. The background is plain white.

About Brian Bastian

Brian Bastian, Head of Product for Property Guardian, is a seasoned product leader and catastrophe risk management professional with deep expertise in wildfire risk solutions and enterprise SaaS development. As a key driver at Green Shield Risk Solutions, Brian has spearheaded the creation of the Property Guardian platform, delivering cutting-edge tools for superior risk selection, portfolio management, and active loss control. With a foundation built at industry leaders like Guy Carpenter and JLT Re, Brian brings a proven track record of transforming complex risk analytics into actionable insights that enhance resilience and drive value for clients. Passionate about innovation and collaboration, Brian also serves on the board of the International Society of Catastrophe Managers, where he champions technology advancements in catastrophe risk management.

Sidebar

Recent Posts

  • What El Niño Means for US Wildfire Losses
  • A $3.7 Billion Summer Puts Canada’s Wildfire Policy Debate on the Underwriting Desk
  • A Big Fire Year, a Quiet Winter, and a Potentially Historic El Niño: What Commercial Portfolios Should Be Planning For
  • U.S. Wildfire Outlook: November 9th to 22nd, 2026
  • Property Guardian Launches Wildfire Susceptibility Scores: Timing Intelligence for Wildfire Risk at the Property Level

Categories

Stay in the Know!

Stay connected with the Property Guardian team! Subscribe to get the latest updates on product launches, feature enhancements, wildfire news, expert mitigation tips, and much more. Don’t miss out on the insights that matter most!

Our Latest Posts

A hillside view looking down at a suburban neighborhood nestled between forest-covered mountains during a stormy, wildfire-hued sunset.
Category: Blog

What El Niño Means for US Wildfire Losses

Evergreen forest in the foreground with layers of wildfire haze over mountain ridges fading into a golden sunset.
Category: Blog

A $3.7 Billion Summer Puts Canada’s Wildfire Policy Debate on the Underwriting Desk

Aerial view showing a sharp divide between a lush green forest and an area charred by wildfire, providing clear visual analytics of the impact.
Category: Blog

A Big Fire Year, a Quiet Winter, and a Potentially Historic El Niño: What Commercial Portfolios Should Be Planning For

Ready to Get Started?

Let us guide you through a personalized demo and create a customized solution that perfectly aligns with your needs. Protect what matters most with a solution built for you.

contact us

Stay in the Know!

Stay connected with the Property Guardian team! Subscribe to get the latest updates on product launches, feature enhancements, wildfire news, expert mitigation tips, and much more. Don’t miss out on the insights that matter most!

Home

About Us

Our Team

Partners

Contact Us

News

Active Wildfires

All Products

Resources

Brochures

White Papers & Case Studies

Videos

Preferred Vendors

  • LinkedIn
  • YouTube
A green hexagon logo with a shield and cityscape design, next to the text “PROPERTY GUARDIAN” and below it, “A Green Shield Company” on a light gray background.

Headquarters:
2551 N Clark St., Suite 302
Chicago, IL 60614

Copyright © 2026 · Property Guardian · All Rights Reserved · Terms of Use · Privacy Policy· Trust Center

By using this website, you agree to our use of cookies. We use cookies to provide you with a great experience and to help our website run effectively. To find out more, please read our Privacy Policy.