

When we launched the Canadian Wildfire Risk Score + Insights in British Columbia and Alberta this August, we started there for a reason: that’s where Canada’s wildfire losses have been most concentrated. But the question we heard most from clients came almost immediately. When can we use it across the rest of our book?
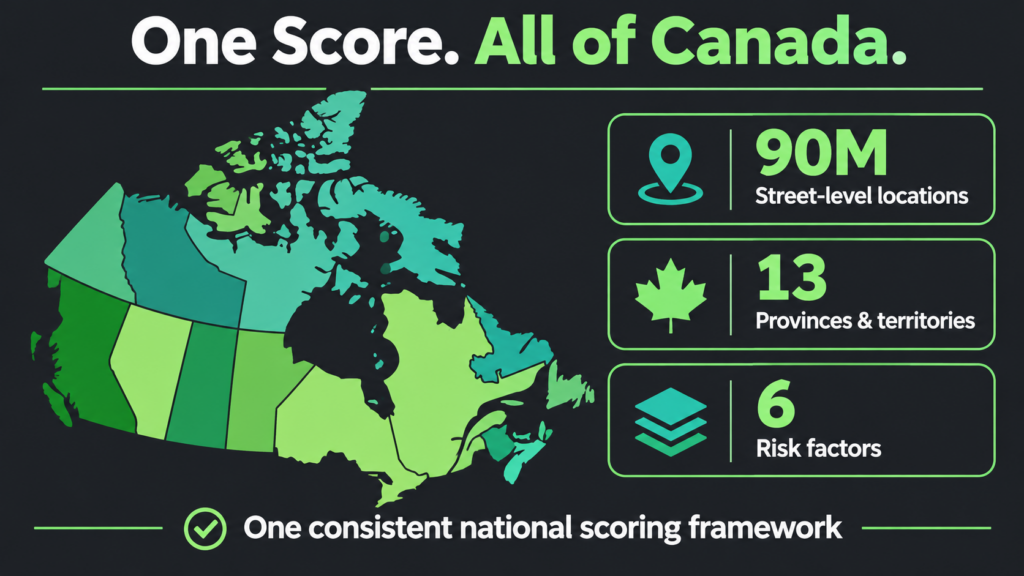
Today we have the answer. As announced in today’s press release, the Canadian Wildfire Risk Score + Insights now covers all 10 provinces and three territories, roughly 90 million street-level locations. Same score, same six factors, same risk classes, from Vancouver Island to Nova Scotia to the Yukon.
Here’s what that means for Canadian underwriters, and why we’re confident the score holds up.
Wildfire Is Now a National Underwriting Problem
For years, wildfire in Canada was treated as a western peril. The last few seasons have changed that.
- 2023 was Canada’s worst wildfire season on record: 16.5 million hectares burned, roughly seven times the long-term average.
- 2024 brought a record $9.2 billion in insured losses from severe weather, according to the Insurance Bureau of Canada, including about $1.3 billion from the Jasper wildfire alone.
- 2025 followed as the second-worst season on record, at roughly 8.3 million hectares.
Wildfire is no longer confined to British Columbia and Alberta, and exposure now reaches carriers’ books in every region. Yet many carriers still rely on tools that were never built for that job: public hazard maps designed for forestry and land management, or fire-protection grades that describe a town’s defences rather than what happens at a specific property.
A carrier writing across Canada shouldn’t need one view of wildfire risk for the West and a patchwork everywhere else. National coverage gives every underwriting team the same consistent, explainable standard, wherever the risk sits.
One Score, Six Transparent Factors
Developed with our Canadian research partner ApexRMS, the Canadian Wildfire Risk Score + Insights is built for underwriting real property in the wildland-urban interface (WUI), where insured losses concentrate. It pairs physics-based fire spread modelling (30-metre national fuels data, 10,000+ Monte Carlo simulations) with structure-level analysis across roughly 9 million Canadian building footprints.
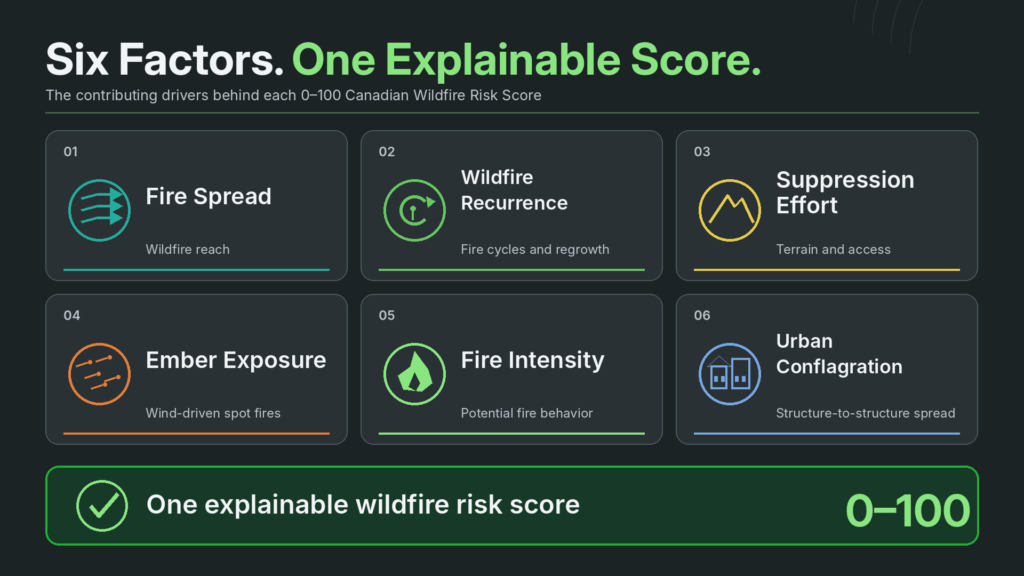
Every location gets a score from 0 to 100 and a risk class, explained by six contributing factors:
- Fire Spread: How likely wildfire is to reach the location in an average season
- Wildfire Recurrence: Fire frequency and vegetation regrowth cycles
- Suppression Effort: How hard the terrain is to reach and defend
- Ember Exposure: Downwind, wind-driven spot-fire exposure
- Fire Intensity: How hot and receptive the fuels are
- Urban Conflagration: Structure-to-structure fire spread
Every score traces back to the factors that drove it. When a broker, reinsurer or regulator asks why a property is priced the way it is, underwriters can point to the specific drivers, not just a number. And because each factor can be used on its own, data science teams can drop individual signals into the models they already run.
The Proof: A Blind, Real-World Test
Any wildfire score looks good on the fires it was built from. The real question is how it performs on fires it has never seen.
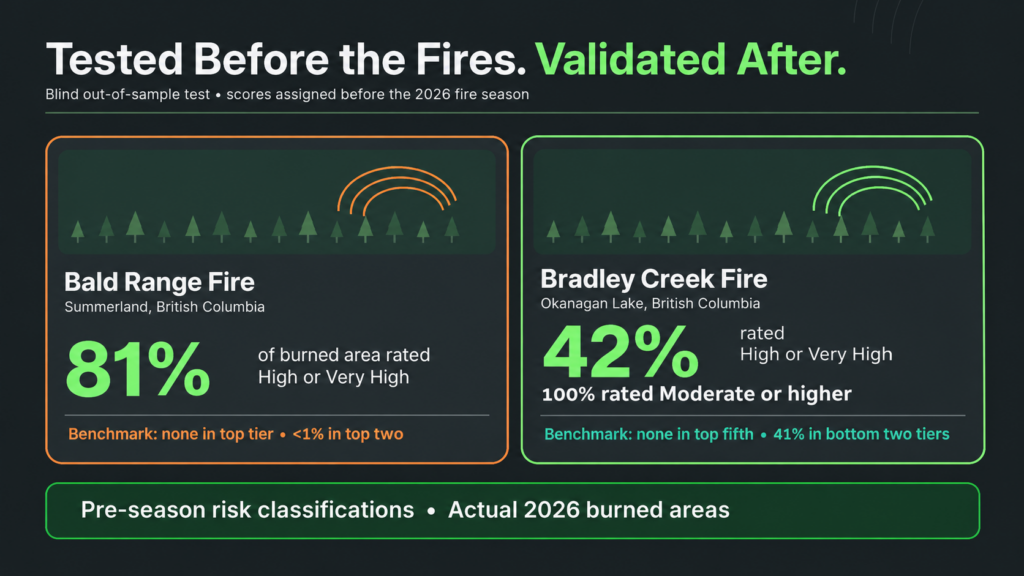
So we put it to that test. We scored every location in Canada before the 2026 wildfire season opened, which meant the model never saw a single outcome from this year’s fires. Then we compared those scores with what actually burned. Two British Columbia fires tell the story.
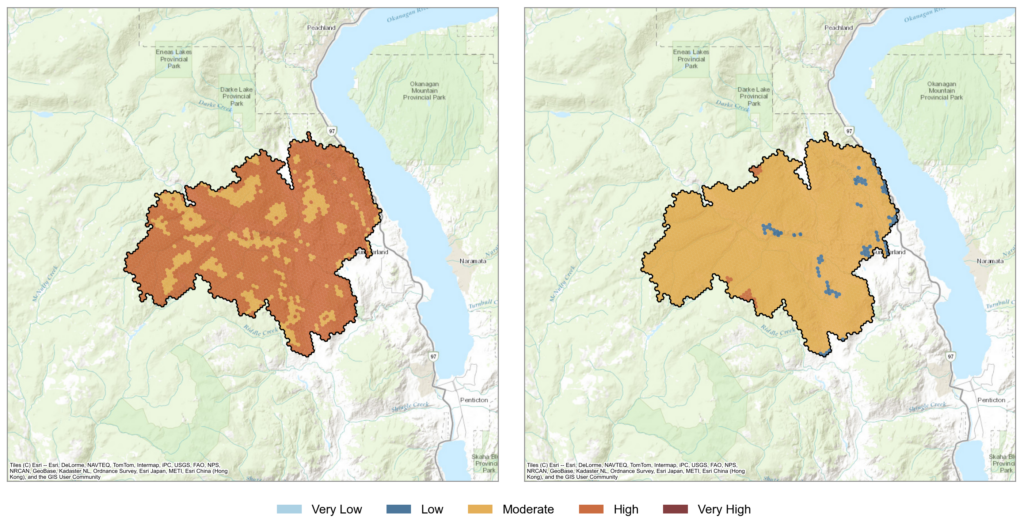
Bald Range fire, Summerland. 81% of the burned area was already rated High or Very High. The industry benchmark placed none of it in its top tier and less than 1% in its top two. CatIQ’s initial estimate puts insured losses at C$313 million across property and auto claims, a reminder that insured loss follows property, not land: a mid-sized fire through orchards and ranchland can still reach nine figures.
Bradley Creek fire, Okanagan Lake. The fire destroyed about 230 homes. Its entire footprint was already rated Moderate or higher, with 42% rated High or Very High. The benchmark placed none of it in its top fifth and 41% in its bottom two tiers.
Bradley Creek also shows why the six factors matter. On Fire Spread alone, those homes would have scored lower and likely been accepted straight through. It was Ember Exposure, Wildfire Recurrence and Fire Intensity that moved the footprint into the top classes, the signals a burn-probability map simply doesn’t carry.
The Wider Validation
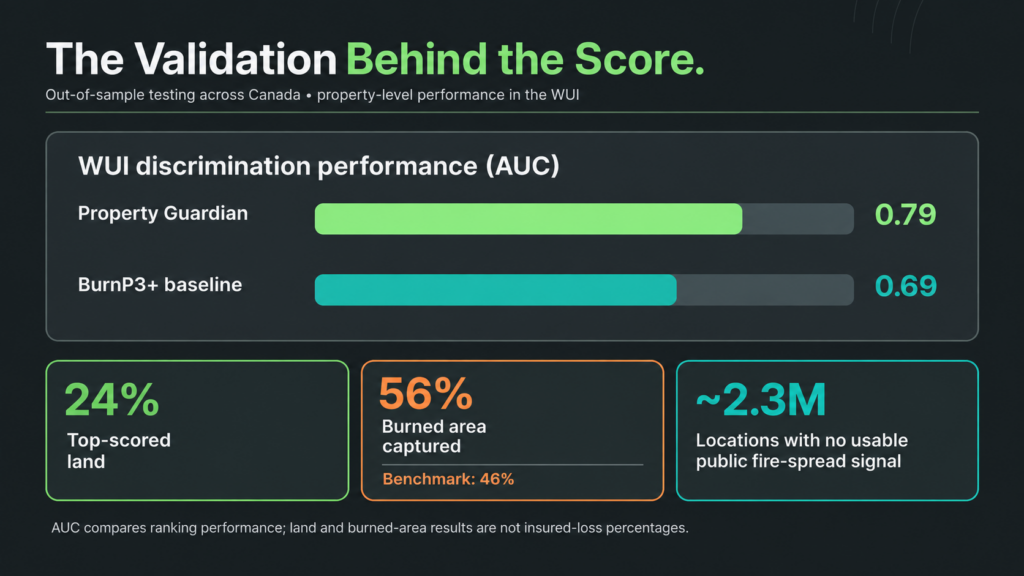
These two fires aren’t one-offs. Our full validation tested the score out of sample, with no look-ahead, against the federal National Burned Area Composite and head-to-head with the industry burn-probability baseline (BurnP3+):
- Stronger where property sits: In the WUI, the score ranked burned locations above unburned ones 79% of the time (AUC 0.79), compared with 69% (AUC 0.69) for the industry baseline.
- Concentrates the risk: The top 24% of land by score captured 56% of the area that burned, compared with 46% for the benchmark.
- Sees risk inside communities: Public fire-spread models are largely blind to the built environment, leaving roughly 2.3 million locations with no usable signal. Our score rates every one of them.
Putting It to Work Across the Policy Lifecycle
Observed burn rates rise at every class step, from 0.03x the average at Very Low to 4.59x at Very High. That clean separation gives underwriting teams clear lines to act on:
- Referral: Send Very Low and Low risks straight through. The lowest half of land by our score burns at 0.19x the average, versus 0.74x for the baseline.
- Pricing: Build an evidence-based relativity ladder at street level, with factors that explain each step.
- Accumulation: See where wildfire exposure concentrates across the portfolio, in every province and territory, using one consistent measure.
- Mitigation: Match the action to the driver. A property flagged for Ember Exposure calls for different mitigation conditions than one flagged for Suppression Effort.
The score complements a catastrophe model rather than replacing it, and it works inside the pricing and underwriting tools clients already use. No rip-and-replace required.
How to Get It
The Canadian Wildfire Risk Score + Insights is available today for every province and territory, three ways:
- API integration: the score, its class and all six factors, embedded directly in underwriting workflows
- Property Guardian Direct: on-demand, single-property lookups and maps
- Bulk Analysis Services: portfolio-wide scoring with a 24-hour turnaround
Clients can also add the Data Science Add-On, with 30+ sub-factor layers and historical vintages for backtesting on their own book, and Field Insights on-site inspections, available in Canada today. And Overwatch active wildfire intelligence for Canada is on the way in time for the 2027 fire season.
See It On Your Own Book
The best way to judge a wildfire score is on your own locations. Send us a sample, and we’ll score it and walk every result back to its drivers. We’re also happy to share the full validation white paper with your underwriting, actuarial or model governance teams.
Request a demo or the validation white paper, or reach out to Brian Bastian, Head of Product, at brian.bastian@greenshieldrisk.com.
Read the full announcement: Property Guardian Takes Its Canadian Wildfire Risk Score + Insights Nationwide, Covering Every Province and Territory
