

The Quick Read
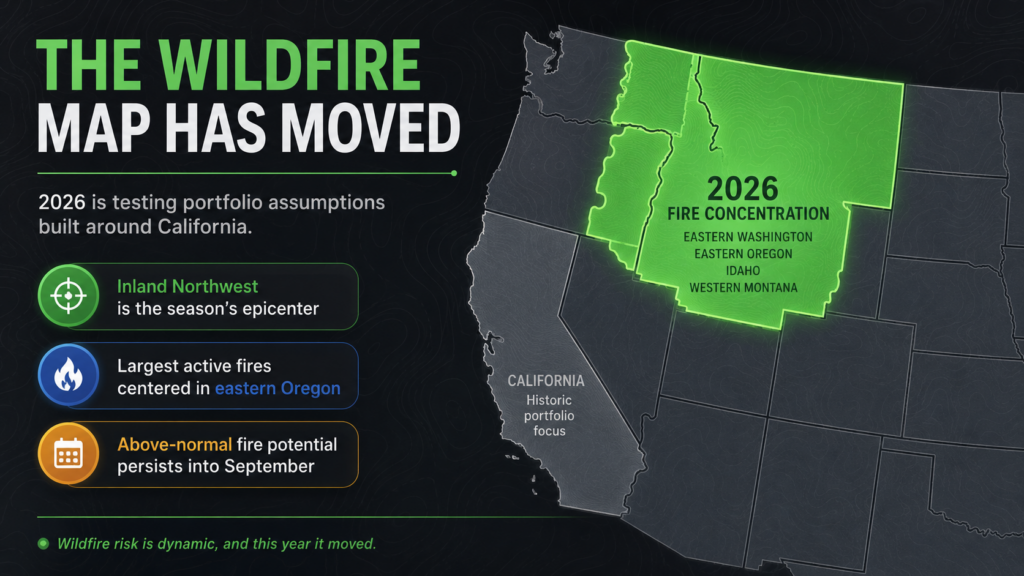
The 2026 fire season has not landed where many commercial portfolios assumed it would. As of early August, roughly 4.9 million acres have burned nationwide, about 163 percent of the ten-year average, and the epicenter is the Inland Northwest, not California. Eastern Oregon is hosting the largest active fires in the country, fires near Spokane have forced mass evacuations, and NIFC keeps above-normal fire potential parked over Oregon, Washington, Idaho, and Montana into September.
For commercial property teams, a season concentrated in the Northwest stresses assumptions built around California. Diversification that looked real on a map can turn into correlated exposure, and the region’s manufacturing, processing, warehousing, data center, and multifamily assets carry business interruption tails that can dwarf the physical damage figure. Wildfire risk is dynamic, and this year it moved.
How Property Guardian Helps: Property Guardian portfolio-level exposure and accumulation views and active fire intelligence help commercial property teams see where insured values actually concentrate against wildfire and track events in near real time, so your exposure map keeps pace with where the fires are.
If your wildfire exposure model still treats California as the whole story, this summer is a warning. As of early August 2026, roughly 4.9 million acres have already burned across the United States, about 163 percent of the ten-year average, spread across more than 44,000 fires. The activity is not concentrated where many portfolios assume it will be. The Pacific Northwest and the broader Inland Northwest are now the clear national epicenter. Eastern Oregon is hosting the largest active fires in the country, and a cluster of fast-moving fires around Spokane recently forced tens of thousands of people to evacuate.
For commercial property underwriters and risk managers, the location of the burn matters as much as the size of it. A season that lands hard in Oregon, Washington, Idaho, and Montana stresses a different set of assumptions than a season centered on the wildland-urban interface of Southern California. It is worth pausing on what the rest of 2026 is likely to bring, and what it means for how commercial books are built and priced.
What the Outlook Actually Says
The National Interagency Fire Center places above-normal significant fire potential across most of the northwestern United States for August, running from central Utah, northwest Colorado, western Wyoming, and northwest Montana westward to the Pacific Northwest coast and into northeast California. The September outlook does not offer much relief in the region. Above-normal potential is forecast to persist across northern Utah, northern Nevada, northeast California, Oregon, Washington, Idaho, northern Montana, western North Dakota, and northern Minnesota.
The seasonal forecast tells a similar story. AccuWeather projects that fires in 2026 will burn between 5.5 and 8 million acres, above the roughly 5.13 million acres burned in 2025, with an estimated 65,000 to 80,000 wildfires nationwide. The drivers are familiar: deep drought, fuels that dried out fast once the mountain snowpack melted, and dry-lightning outbreaks that ignite fires far from population centers and firefighting resources.
Why the Geographic Shift Is an Underwriting Problem
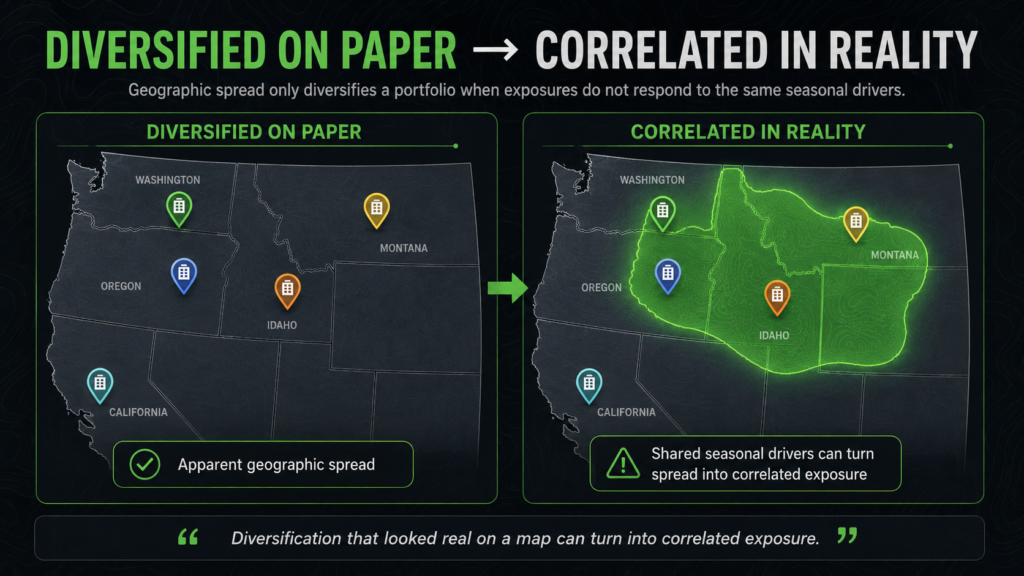
Much of the commercial wildfire underwriting discipline built over the past decade was shaped by California losses. That focus is understandable, but it can create a blind spot. When a book is diversified on paper because exposure is spread across several western states, the diversification only holds if those states do not burn in the same season. A year like 2026, where the risk concentrates in the Inland Northwest, can turn what looked like geographic spread into correlated exposure.
The commercial footprint in these regions is substantial and often under-appreciated. Eastern Oregon and Washington carry agricultural processing plants, food and beverage manufacturing, warehousing and distribution centers, wood-products facilities, wineries, and a growing base of data centers drawn by cheap power and cool climates. Idaho and Montana add hospitality, resort, and multifamily exposure in fast-growing interface communities. These are not marginal risks. They are revenue-generating assets whose business interruption and contingent business interruption tails can dwarf the physical damage figure, especially when a single wildfire disrupts a regional supply chain or forces a multi-week evacuation.
There is also a modeling gap to be honest about. States outside California have historically drawn less granular attention in some portfolios, and interface growth has outpaced the assumptions baked into older exposure views. A property that scored as low-tier three years ago may sit in a corridor that has since filled in with fuel, structures, and people.
Practical Takeaways for Commercial Property Teams
First, re-run accumulation views with the Inland Northwest treated as a primary wildfire region rather than a secondary one. Look specifically for clusters of insured values in eastern Oregon, eastern Washington, Idaho, and western Montana that may have been assumed to be independent of your California concentration but could respond to the same seasonal drivers.
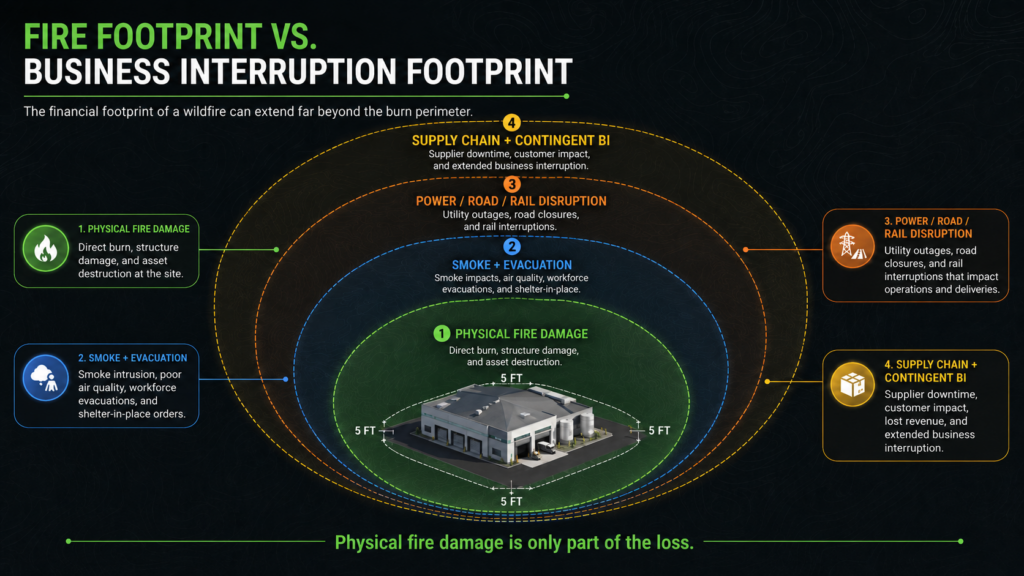
Second, pressure-test the business interruption and contingent business interruption assumptions on manufacturing, processing, and logistics accounts in these states. Physical fire damage is only part of the loss. Smoke, prolonged evacuation, road and rail closures, and power shutoffs can idle an operation long after the flame front has passed.
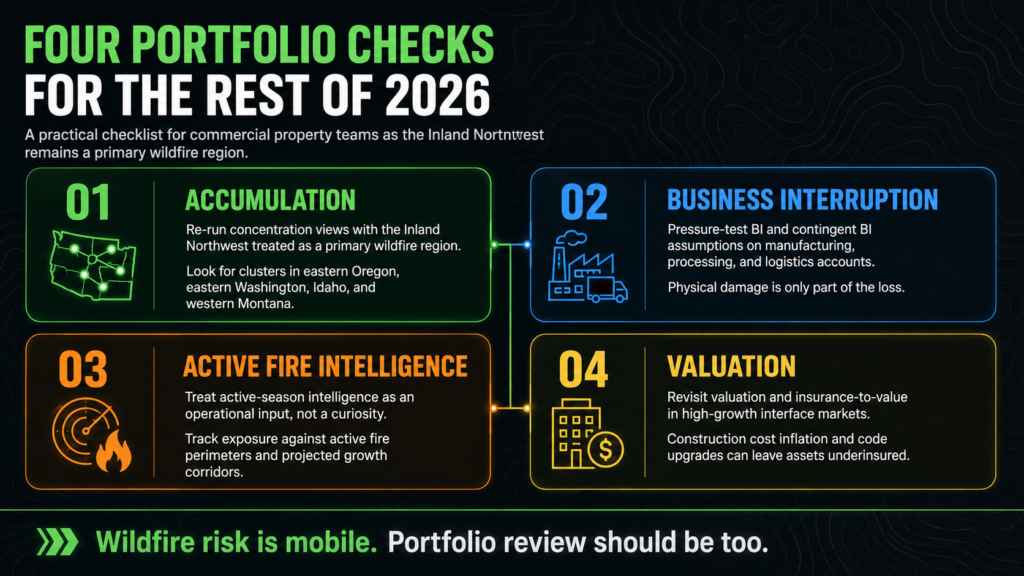
Third, treat active-season intelligence as an operational input, not a curiosity. When a large fire is moving in a region where you hold exposure, the value of near-real-time information rises sharply. Knowing which insured locations sit inside an active fire perimeter or a projected growth corridor changes claims readiness, loss reserving, and communication with insureds and reinsurers.
Fourth, revisit valuation and insurance-to-value on assets in high-growth interface markets. Construction cost inflation and code upgrades mean that a facility insured to a figure set a few years ago may be materially underinsured today, and a total loss in a remote area can be slower and more expensive to rebuild than the same loss in a metro.
The Bottom Line
The 2026 season is a reminder that wildfire risk is mobile. It follows drought, fuel, and weather, and this year those have lined up over the Inland Northwest. Portfolios that quietly assumed California was the only place worth watching are being tested. The teams that come through this season well will be the ones that treated geographic rebalancing as a live underwriting question rather than a footnote.
This is where Property Guardian focuses. Our portfolio-level exposure and accumulation views help commercial property teams see where insured values actually concentrate against wildfire risk across the West, and our active fire intelligence puts near-real-time event information in front of underwriters and risk managers while a season like this one is still unfolding. If your exposure view was built around a map that no longer matches where the fires are, we can help you redraw it.
Sources
AccuWeather 2026 Wildfire Season Forecast
NIFC National Significant Wildland Fire Potential Outlook (August through November 2026)
2026 United States wildfires (overview)
Property Guardian, Weekly U.S. Wildfire Outlook, Week of August 3, 2026
