

The Quick Read
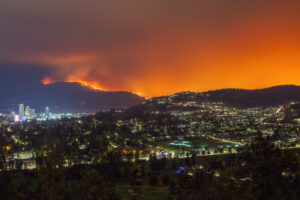
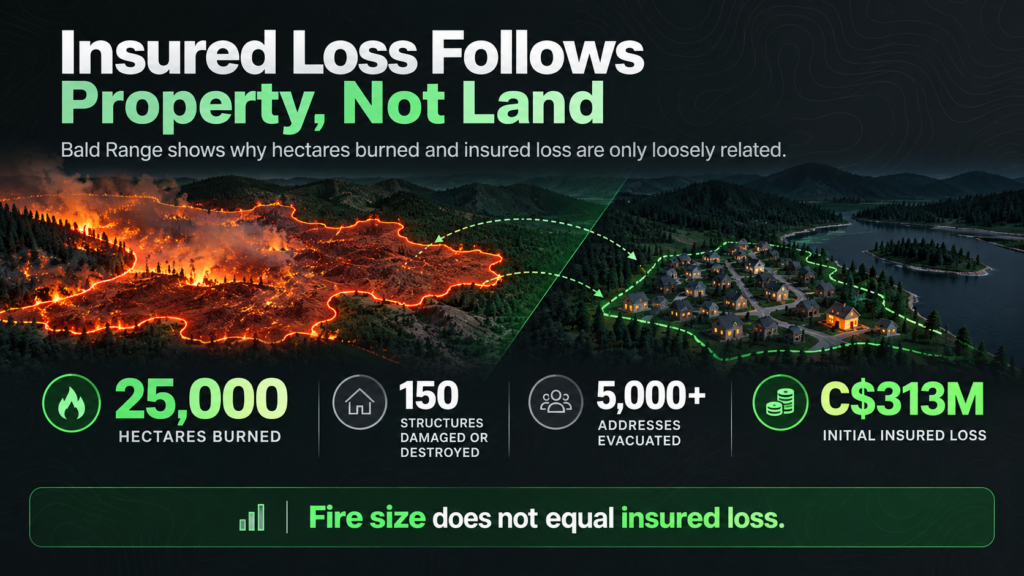
CatIQ released its first industry loss estimate for the Bald Range wildfire on September 16: C$313 million, covering residential and commercial property, vehicle claims and loss adjustment expenses. The fire burned roughly 25,000 hectares near Summerland, British Columbia, between August 7 and 18, damaged or destroyed about 150 structures and put more than 5,000 addresses under evacuation orders for nearly two weeks.
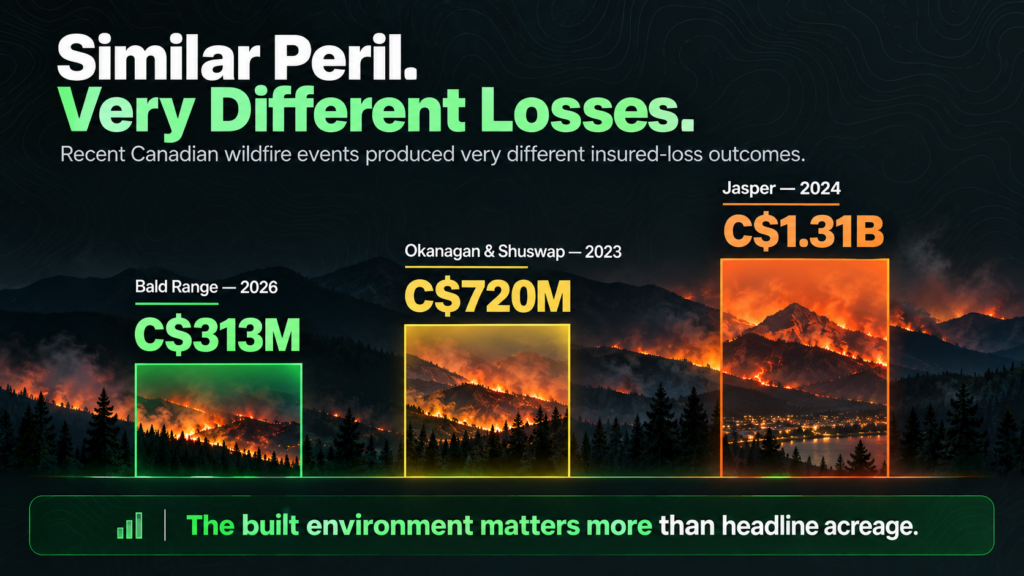
The figure came in below many market expectations, and it sits well under the 2023 Okanagan and Shuswap fires (C$720 million) and Jasper (C$1.31 billion after revisions). For personal lines, commercial property and reinsurance teams, the lesson is that hectares burned and insured loss are only loosely related. Property density, value concentration and where the fire front meets the built environment matter far more.
How Property Guardian Helps: Property Guardian’s Canadian Wildfire Risk Score + Insights gives underwriters and portfolio managers a location-level view of exposure, so accumulation in places like the Okanagan can be understood before the next fire, not after the first loss estimate.
A Fire that Behaved Like a Catastrophe and Priced Like a Mid-sized One
When the Bald Range fire ignited on August 7, it did what the most dangerous Okanagan fires do. It grew from a start to more than 10,000 hectares in about 24 hours, pushed by wind and dry fuels, and forced the evacuation of the Summerland area. British Columbia declared a provincial state of emergency the next day. Premier David Eby described the early spread as a bomb going off.
Five weeks later, CatIQ put a first number on it. The initial industry estimate of C$313 million includes residential and commercial property, motor claims and additional loss adjustment expenses. About 150 structures were damaged or destroyed, and more than 5,000 addresses were under evacuation orders for close to two weeks.
On a first read, that is a significant loss. Against the recent record, it is also a modest one. The 2023 Okanagan and Shuswap fires reached about C$720 million. Jasper, in 2024, reached C$1.31 billion after starting closer to C$880 million. Bald Range burned a comparable footprint to some of these events yet produced a fraction of the insured loss.
Why Hectares Are a Poor Guide to Insured Loss
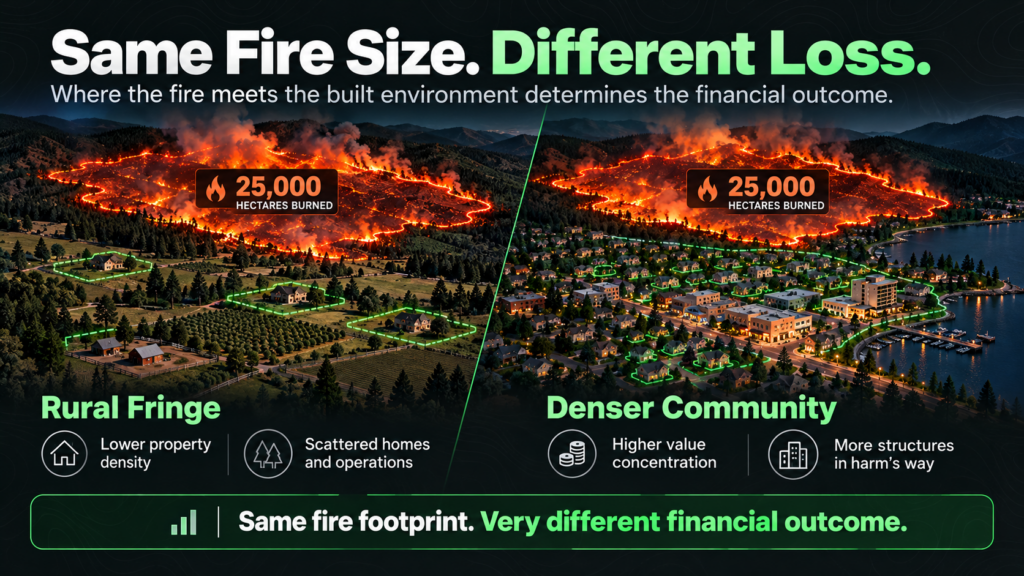
The explanation is not mysterious, but it is easy to overlook in a season of large headline numbers. Insured loss follows property, not land. The Bald Range damage was concentrated in lower-density rural communities rather than in dense, high-value urban blocks. A fire that burns 25,000 hectares through orchards, ranchland and scattered homes behaves very differently, financially, from one that reaches a town centre.
The same pattern ran through the whole 2026 season. Nationally, wildfire activity has been enormous, with roughly 4 million hectares burned by mid-August. Yet Morningstar DBRS has noted that the bulk of the burning occurred in northern Ontario and Quebec, where property density and insured values are comparatively low. British Columbia and Alberta, the provinces that usually drive the largest insured losses, have burned below their 10-year averages.
CatIQ’s own commentary points the same way. Director Caroline Floyd noted that British Columbia has seen about 90 percent of its 20-year average burned area this year but only about 80 percent of the average number of fires. In other words, fewer fires, each doing more. That is a signature of intensity, and intensity is what turns a rural fire into a community-level event when the wind shifts.
Treat the First Estimate As a Floor
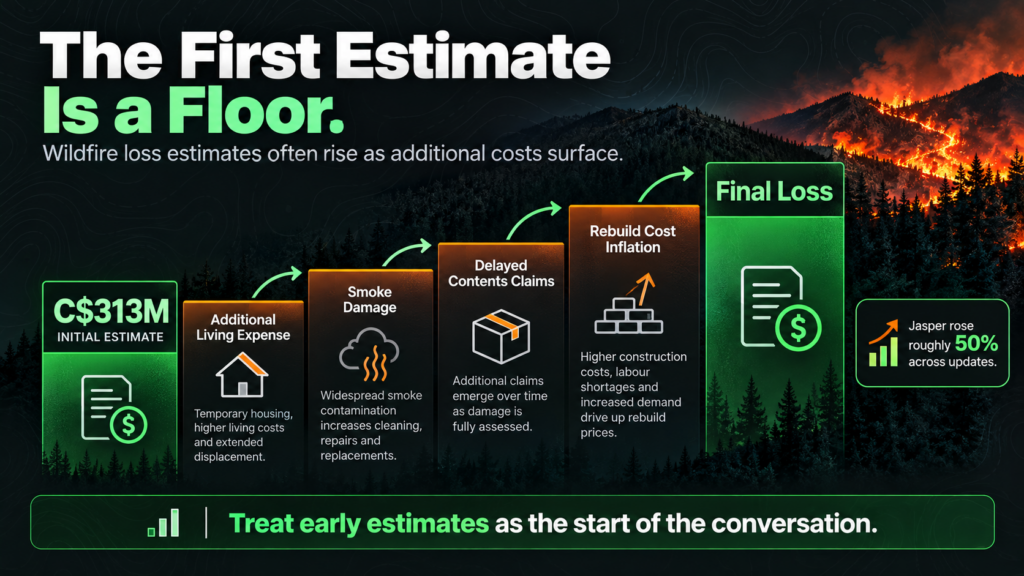
Industry loss estimates for Canadian wildfires have a history of moving up. Jasper’s estimate climbed by roughly 50 percent across updates. Additional living expenses, smoke damage, delayed contents claims and rebuild cost inflation all take time to surface. Brokers and reinsurance buyers should assume that C$313 million is where the conversation starts, not where it ends.
The line-of-business mix matters too. Because the estimate blends residential, commercial and motor claims, the headline number hides who actually carried the loss. Personal lines carriers with concentrated Okanagan books will have felt this event very differently from a national writer with a diversified footprint. Commercial and specialty underwriters should look at agricultural operations, tourism and hospitality properties, and the supply chains that run through the valley.
Practical Takeaways
For personal lines underwriters and product leaders: look at accumulation by community, not by province. A province can have a below-average burn year and still produce a C$313 million event in a single valley. Test your exposure against scenarios where a fire of this size reaches a denser neighbourhood rather than the rural fringe.
For commercial property and specialty underwriters: confirm the values and occupancies in the wildland-urban interface zones of the Okanagan, Thompson and Kootenay regions. Check business interruption and contingent BI assumptions for agricultural, tourism and light industrial risks that depend on road access and evacuation-free operation.
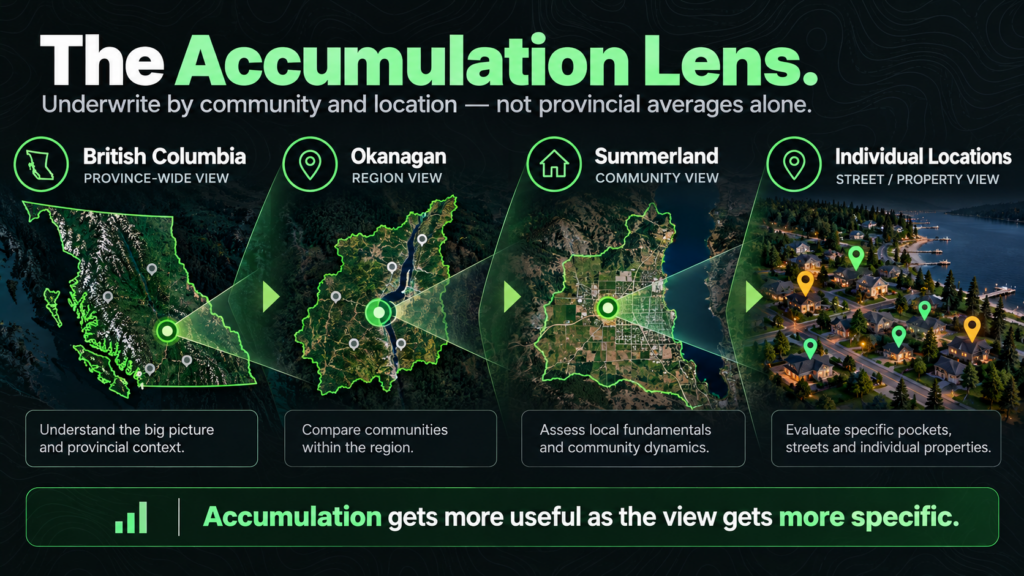
For brokers and corporate risk managers: use the post-event moment to review coverage before the next alert. Civil authority, additional living expense and extended BI limits are far easier to discuss in October than in the middle of an evacuation.
For reinsurers and capital providers: Bald Range is a useful reminder that frequency of mid-sized events can matter as much as one large one. British Columbia has already declared three catastrophes in 2026. Event-by-event losses that look manageable can still add up against aggregate covers and retentions.
What the Season Is Really Telling Us
Canada has now had several seasons in which the burned area headline and the insured loss headline point in different directions. That is good news for balance sheets this year, but it should not be read as a structural improvement. The difference between a C$313 million event and a C$1.3 billion one is often a matter of a few kilometres and a change in wind direction. The Okanagan, Jasper and Fort McMurray all show the same underlying exposure: valuable property sitting close to flammable landscapes.
Understanding where that exposure sits, at the address level and across a portfolio, is the practical work that remains once the loss estimates settle.
How Property Guardian Can Help
Property Guardian’s Canadian Wildfire Risk Score + Insights is built for exactly this question: where does your wildfire exposure really sit, and how would an event like Bald Range look if it landed on a different part of your book? Location-level scoring and portfolio-level accumulation views help underwriting, reinsurance and risk teams move from provincial averages to a clear picture of their own exposure.
Sources
CatIQ, “CAD 313M: CatIQ Discloses Initial Loss Estimate for Bald Range Fire,” September 15, 2026.
