Wildfire Recurrence Scores
Wildfire Recurrence Scores deliver first-view wildfire intelligence for risk triage and risk optimization — forecasting when and where fire is most likely to return across the contiguous U.S.
Go Beyond Hazard Maps
Cost-effective recurrence signals — with a clear path to double click when needed
Updated weekly, our Wildfire Recurrence Scores forecasts wildfire likelihood and timing to help teams make faster, more consistent decisions without relying on static hazard layers. It’s designed around two core workflows — one for high-throughput underwriting triage, and one for time-informed portfolio and policy optimization.

Wildfire Recurrence for Risk Triage
- Scalable underwriting triage: First-pass filter to prioritize submissions and reduce manual review time
- Cost-efficient risk allocation: Reserve higher-cost tools and deeper analysis for the properties that truly warrant it
- Profitable wildfire growth: Strong alignment between higher recurrence signals and real activity supports confident appetite expansion

Wildfire Recurrence for Risk Optimization
- Time-informed policy decisions: Make smarter choices on term length, renewal strategy, and timing based on how soon fire may recur
- Smarter portfolio growth & rebalancing: Identify where to grow, maintain, or reduce exposure using regional and portfolio recurrence patterns
- Deeper risk dynamics: Move beyond severity snapshots to understand wildfire frequency and timing — not just hazard today
Recurrence Scores by the Numbers
uniform land units analyzed nationwide (100% contiguous U.S. coverage)
of wildfire history incorporated (1900-2025)
overlap with high-risk areas in the top 1% of land units
refresh cycle to account for new wildfire activity
How They Work:
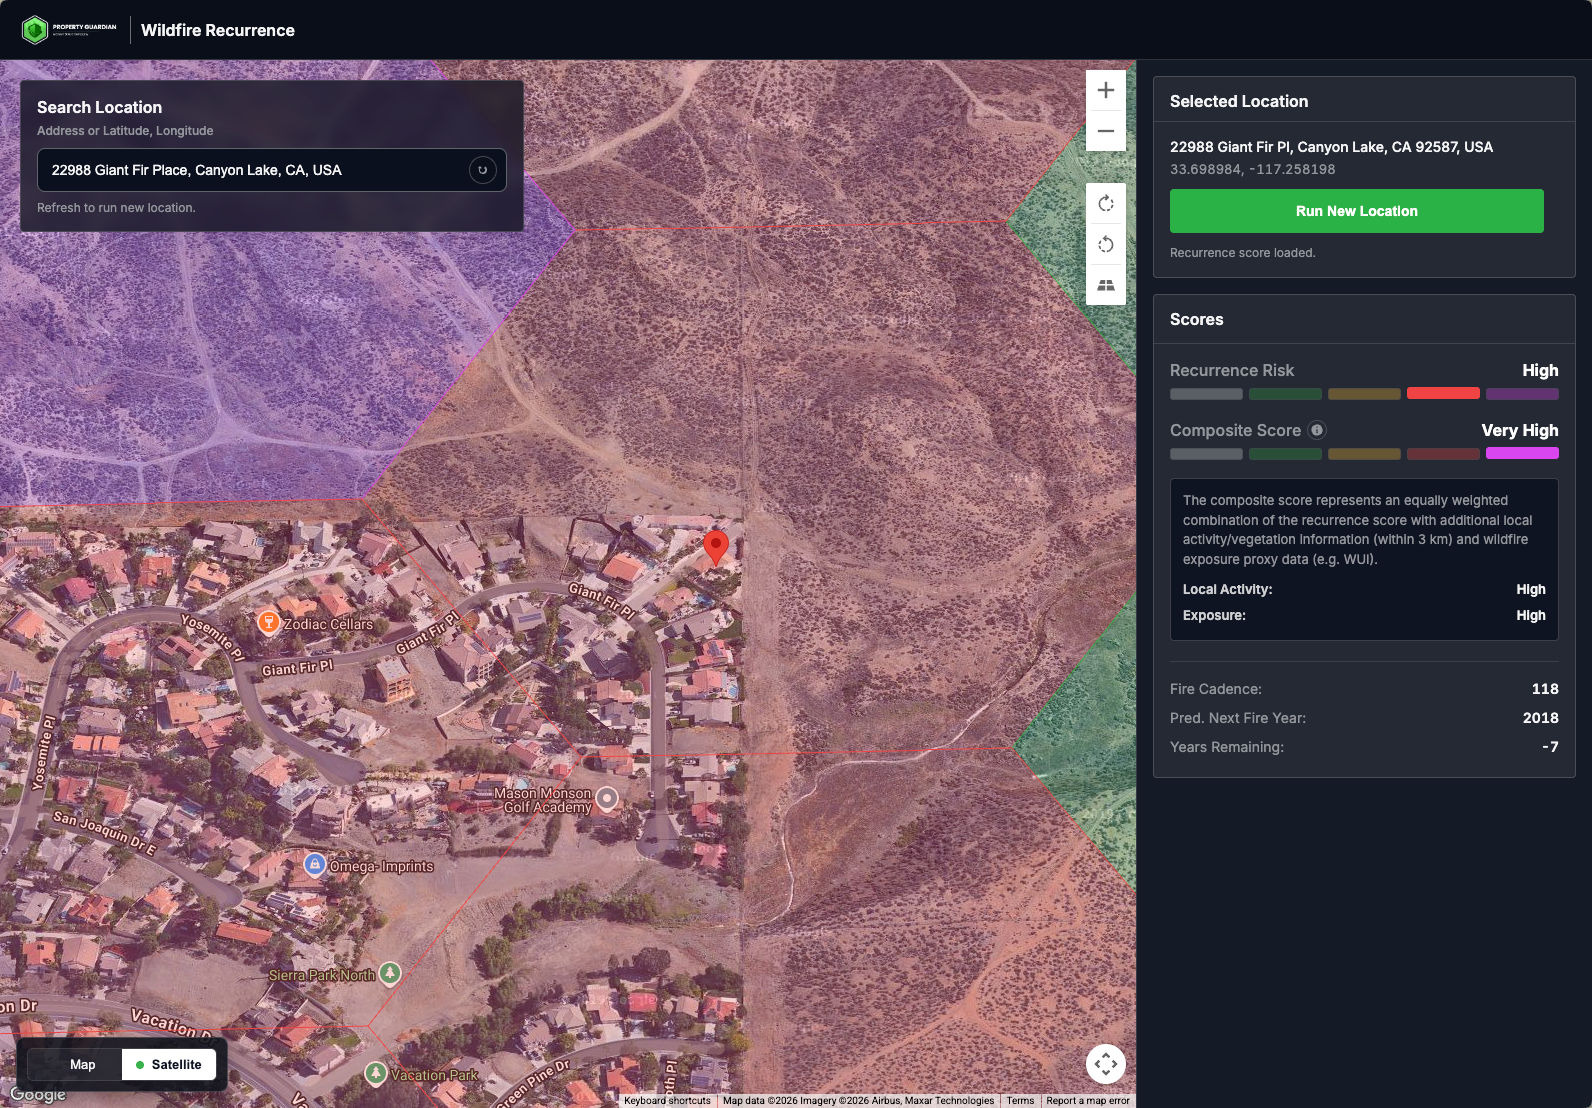
- Recurrence Risk Score: Estimates years remaining until the next fire, then converts that timing signal into a categorical score.
- Composite Score: Combines the recurrence score with two additional hazard components to account for general hazard context.
- Model foundation: Built on 125 years of history across 74.5M uniform land units, updated weekly, using a survival model (Cox Proportional Hazards) and Negative Binomial modeling to estimate occurrence and timing.
The result is a Composite Recurrence Score mapped to five clear categories: Very Low, Low, Moderate, High, and Very High.
Ready to strengthen your wildfire underwriting strategy?
Contact us to learn how the Wildfire Recurrence Score can integrate into your risk selection and pricing workflows.