March 18, 2026
By Brian Bastian, Head of Product
A recently published paper in Earth’s Future takes a serious look at one of the harder problems in wildfire science: predicting where and when ignitions occur across the western United States.
The study — Predictive Understanding of Wildfire Ignitions Across the Western United States (Pourmohamad et al., 2026) — analyzes more than 500,000 wildfire ignition records from 2000–2020 and applies machine learning to estimate daily ignition probability across the region.
It’s a thoughtful and well-executed piece of work.
But reading it reinforces something we think about constantly when working on wildfire risk:
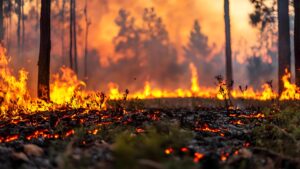
Wildfires may start regionally.
Loss happens locally.
And often at the scale of a single structure.
A Broader Way to Think About Ignitions
One of the most important observations in the paper is also one of the simplest:
More than 60% of wildfire ignitions in the western U.S. are human-caused.
That statistic complicates the way wildfire risk is often discussed.
Weather and climate determine when fuels are receptive to fire. But human behavior, infrastructure, and land use patterns often determine where ignitions actually occur.
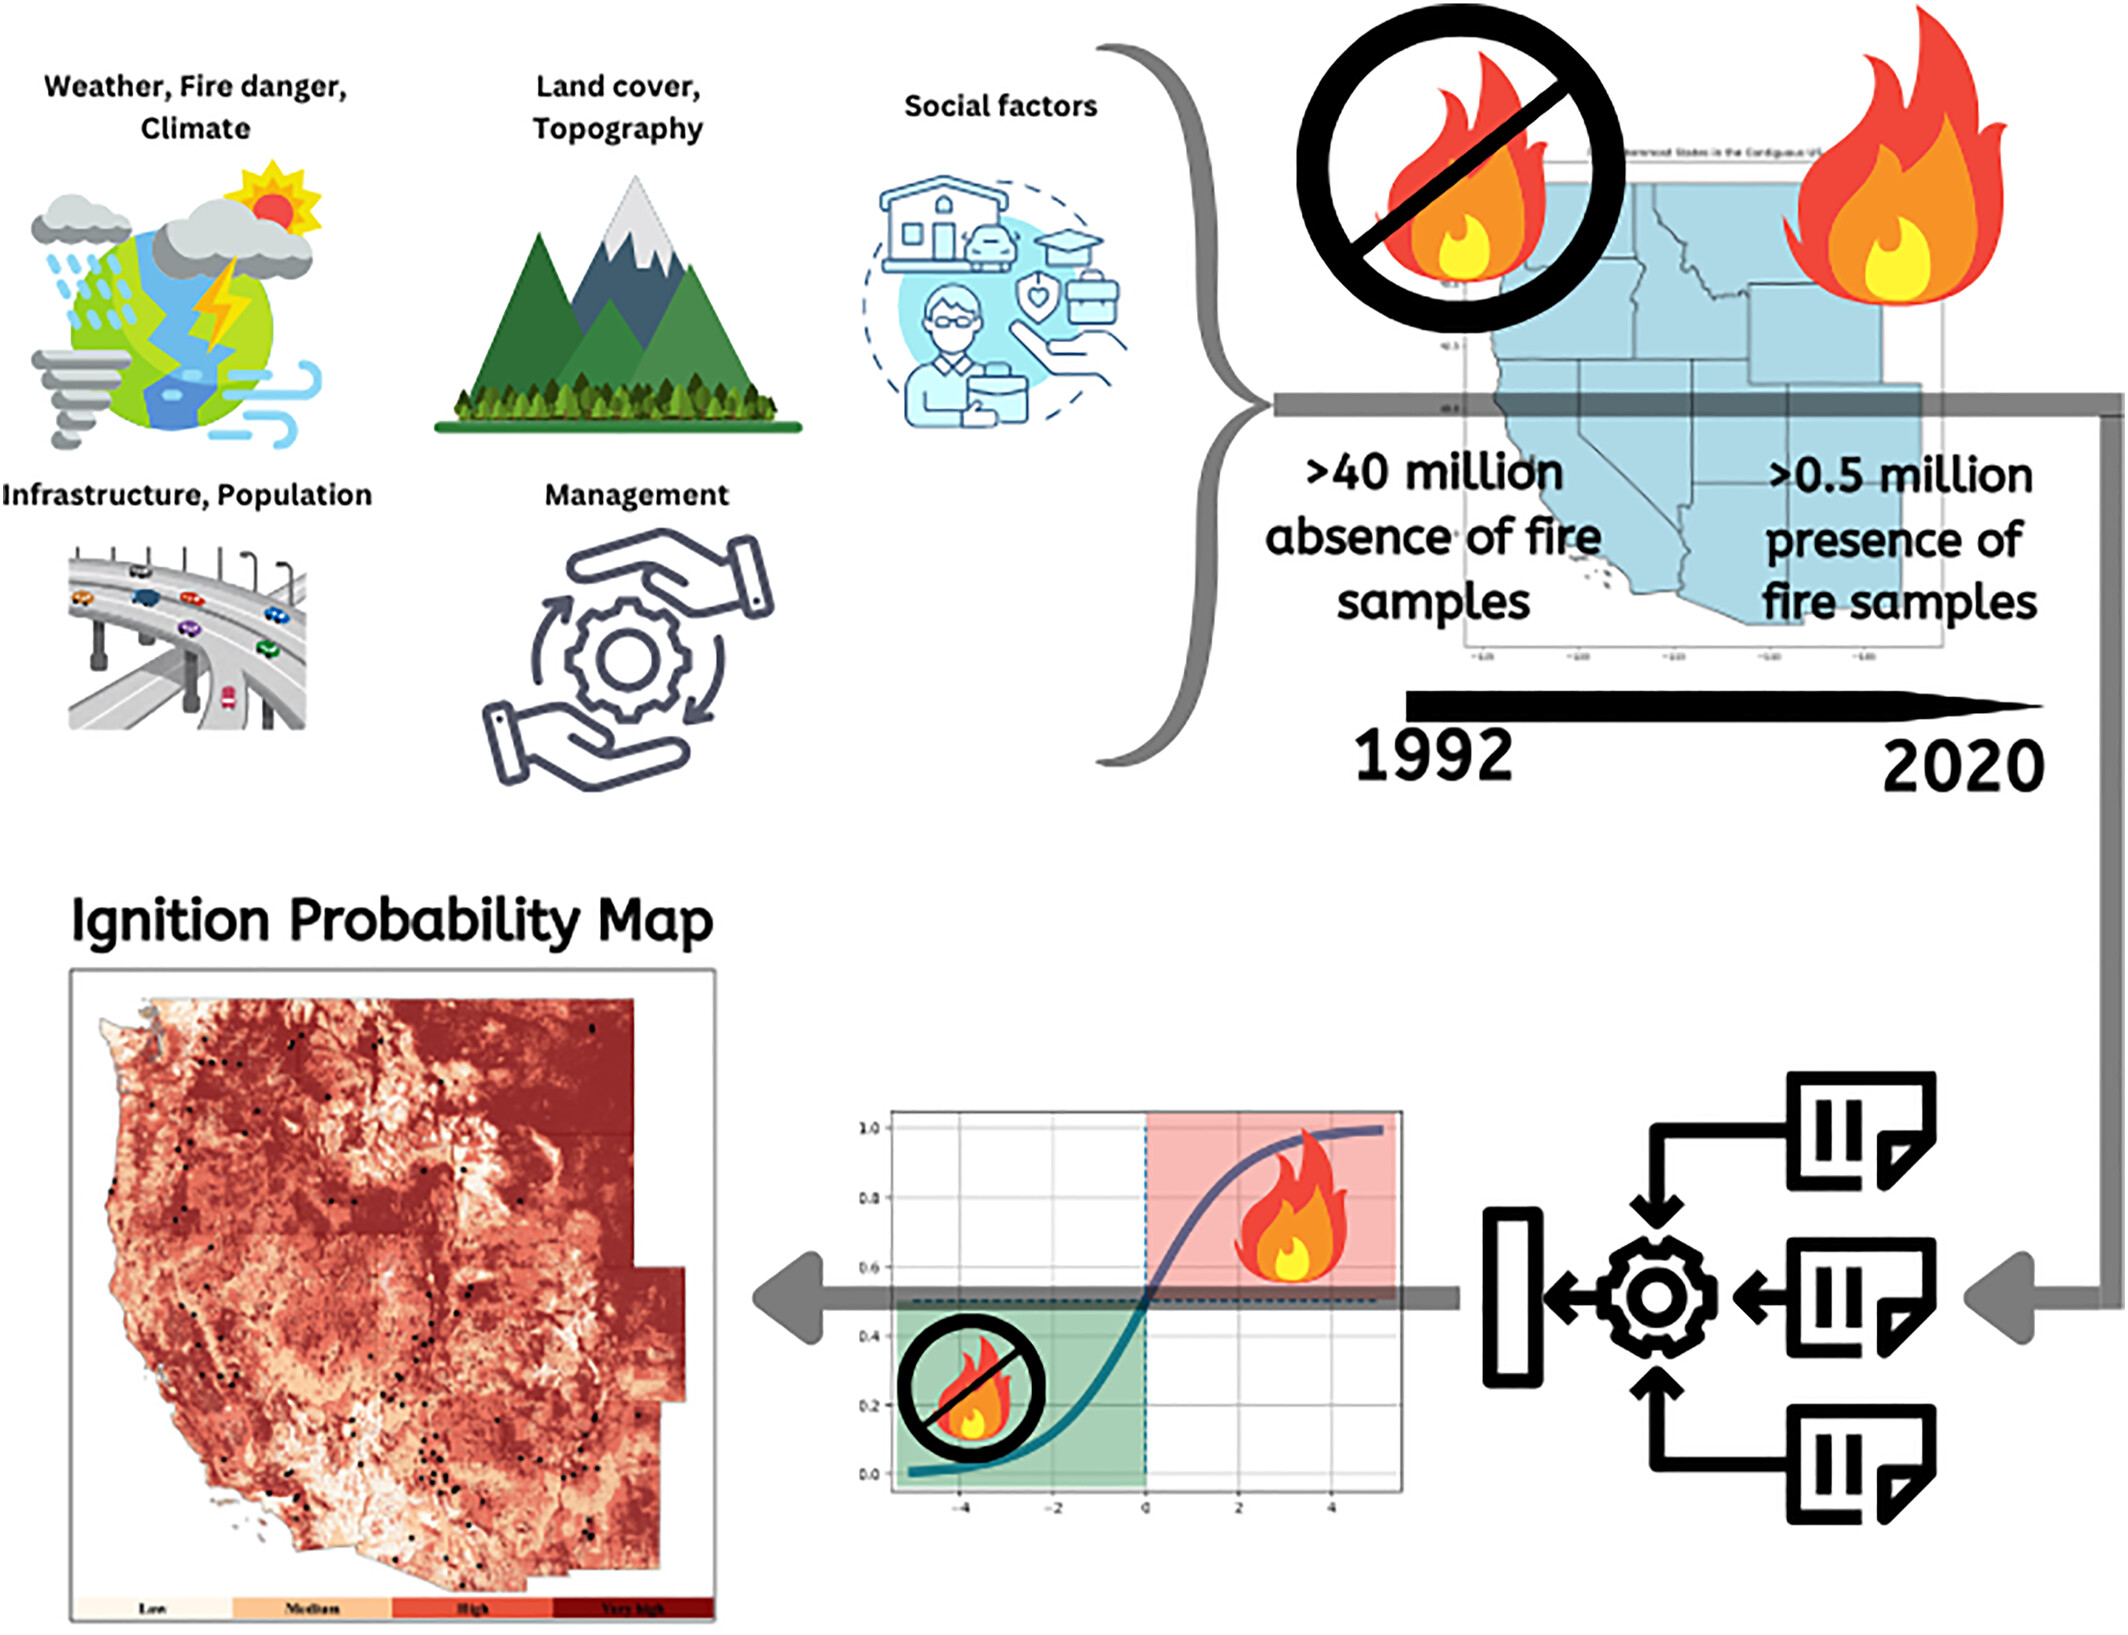
The researchers account for this by combining a wide range of variables in their models:
- Weather and fire danger indicators
- Vegetation and topography
- Population density and human modification
- Fire management and suppression indicators
This type of integrated approach is important. Ignitions aren’t driven by climate alone. They emerge from the interaction between environmental conditions and human systems.
A Clever Improvement in the Modeling
The study integrates weather, environmental, social, and management variables to estimate daily wildfire ignition probability across the western United States. This type of regional modeling helps identify where fires are more likely to start. However, ignition probability is only one piece of wildfire risk. Once a fire begins, outcomes are heavily influenced by conditions at the parcel and structure scale—where mitigation decisions actually occur.
One of the more interesting contributions in the paper involves how the researchers handle what’s known as absence data.
Machine learning models need examples of both:
- Places where fires occurred
- Places where fires did not occur
Historically, many wildfire studies have generated “no-fire” data by randomly sampling locations across the landscape.
The authors show that this can distort model performance. Random absence samples often represent places that were never realistically capable of igniting in the first place.
Instead, they introduce spatially and temporally stratified sampling.
In simple terms, they select absence points that look very similar to real ignition locations in both space and time.
That forces the model to learn something much more meaningful: the difference between places that ignite and places that almost ignite.
What Actually Drives Ignitions
Across their models, several variables consistently influence ignition probability.
Among the most important:
- Annual temperature
- Seasonal timing (day of year)
- National preparedness level
- Long-term fire trends
Additional drivers include vapor pressure deficit, fuel moisture, population density, and measures of human modification.
The takeaway is fairly straightforward:
- Weather creates the opportunity for ignition.
- Human activity often determines where it occurs.
This is especially true in the wildland-urban interface, where infrastructure, recreation, and development intersect with burnable fuels.
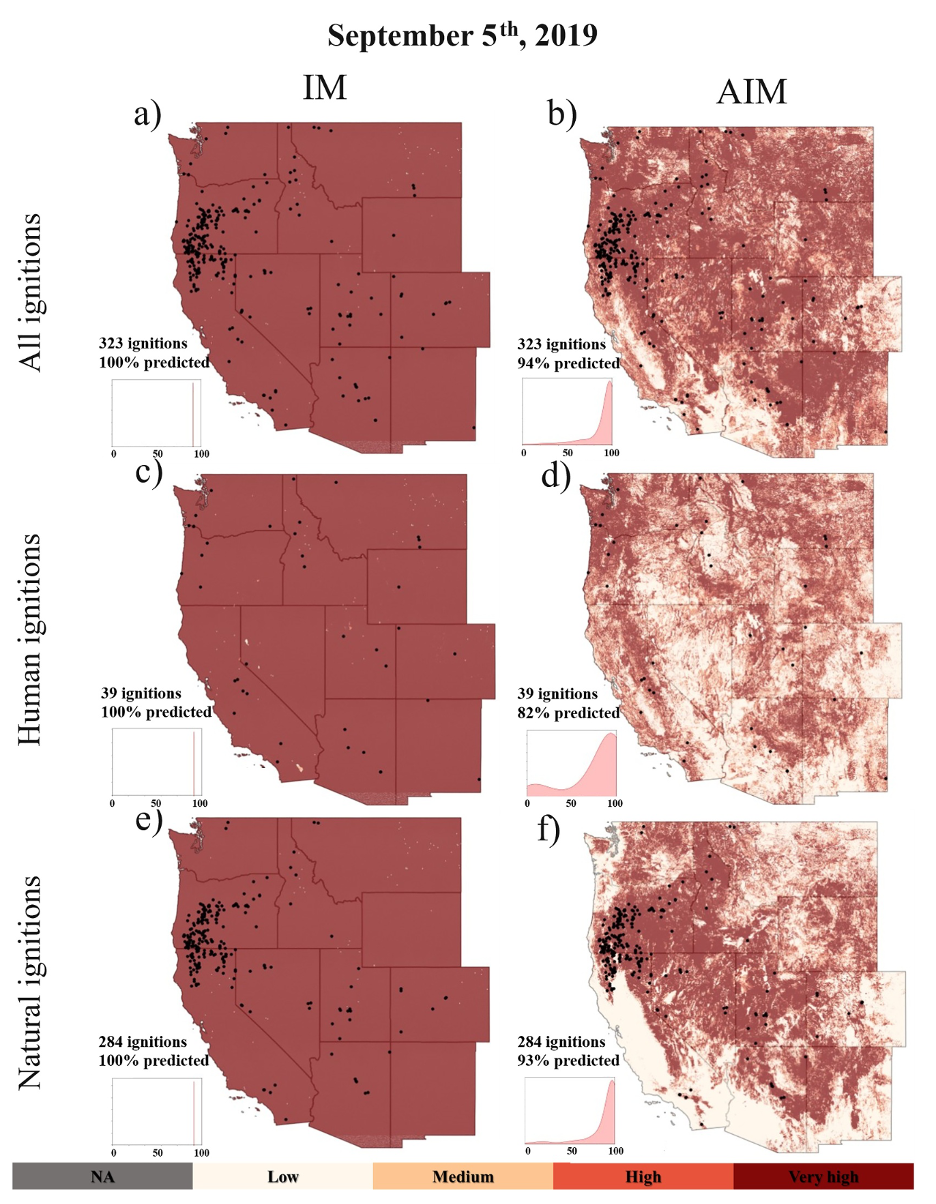
What the Ignition Maps Show
Machine learning models trained on historical ignition data can produce daily maps of where fires are most likely to start. Notice how higher probabilities cluster around foothill regions, infrastructure corridors, and areas where human activity intersects with burnable fuels. These patterns highlight an important reality: many damaging wildfires begin at the edge of developed landscapes.
Using their models, the authors generate daily ignition probability maps across the western U.S.
Two patterns emerge clearly.
Natural ignitions — largely lightning — cluster in mountainous terrain where lightning activity and fuels coincide.
Human-caused ignitions follow a very different pattern. They cluster near roads, settlements, and infrastructure.
Foothill regions surrounding major valleys stand out in particular.
Anyone who has spent time studying wildfire starts will recognize this immediately. Many of the most destructive fires begin precisely where human activity meets wildland fuels.
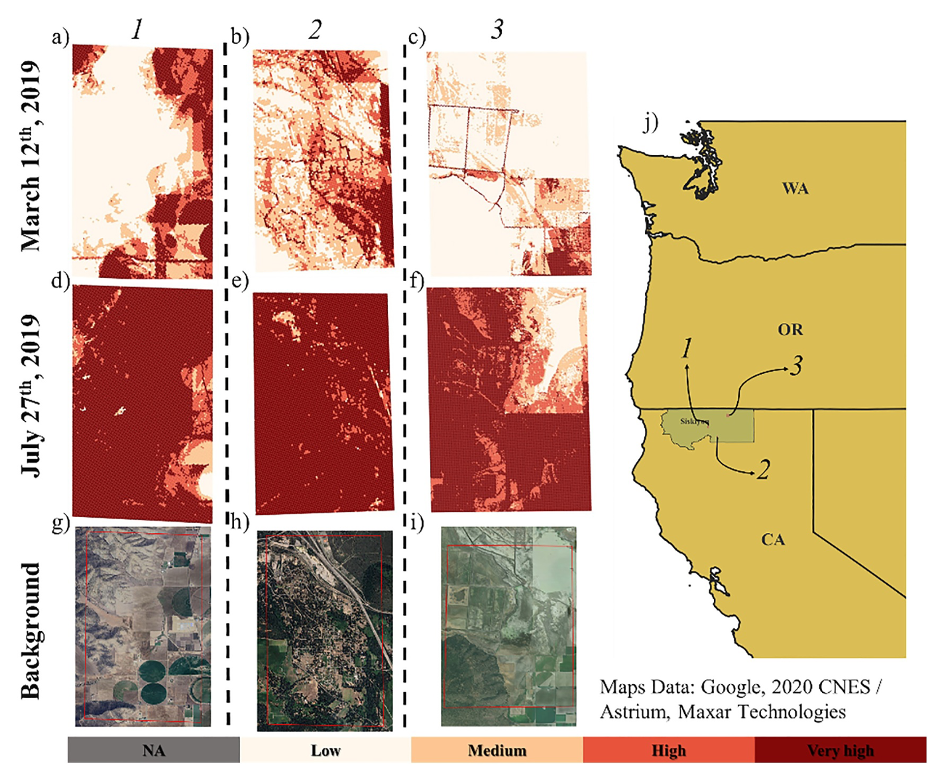
Where Regional Models Reach Their Limits
Even within a relatively small area, ignition probability can vary significantly depending on vegetation, land use, and proximity to infrastructure. But once a fire starts, structure survival often depends on even finer-scale conditions—defensible space, fuel continuity near structures, and building characteristics. This gap between regional ignition modeling and parcel-level vulnerability is one of the key challenges in wildfire risk assessment.
Research like this is incredibly valuable. Regional ignition models help land managers understand patterns across large landscapes and can inform prevention and resource allocation.
But once you zoom in, an important limitation appears.
Even at a 1 km resolution, a single grid cell may contain:
- Hundreds of individual structures
- Multiple vegetation types
- Varying slopes and fuel loads
- Very different defensibility conditions
Two homes within the same grid cell can experience completely different outcomes during the same fire.
One survives.
One does not.
And the difference often comes down to conditions at the parcel and structure scale.
The Gap Between Ignition and Loss
Ignition probability is an important piece of wildfire risk.
But it’s only the first step.
Once a fire starts, structure survival depends on factors like:
- Defensible space
- Vegetation management
- Building materials
- Ember exposure pathways
- Slope and wind exposure near the structure
These factors operate at scales far smaller than regional ignition models.
This gap between where fires start and where damage occurs is exactly the challenge that motivated much of our work at Property Guardian.
Understanding wildfire risk in a way that supports real mitigation decisions requires looking at risk at the parcel and structure level, not just across large landscape grids.
Where Wildfire Risk Modeling Is Headed
The future of wildfire risk modeling will likely involve several layers working together:
- Regional ignition probability models
- Fire spread and behavior modeling
- Parcel-level vulnerability analysis
Each answers a different question.
Where might a fire start?
How might it spread?
Which structures are most likely to be damaged?
Taken together, these perspectives create a far clearer picture of wildfire risk.
Research like the work by Pourmohamad and colleagues moves the science forward in meaningful ways.
The next step is translating those insights into actionable risk intelligence at the property scale, where mitigation decisions actually happen.
Because ultimately, wildfire resilience isn’t determined at the scale of a kilometer.
It’s determined in the first 100 feet around a structure.
Reference
Pourmohamad, Y., Abatzoglou, J. T., Fleishman, E., Belval, E., Short, K. C., Williamson, M., et al. (2026). Predictive understanding of wildfire ignitions across the western United States. Earth’s Future, 14, e2025EF006935. https://doi.org/10.1029/2025EF006935