
April 23, 2026
By Brian Bastian, Head of Product
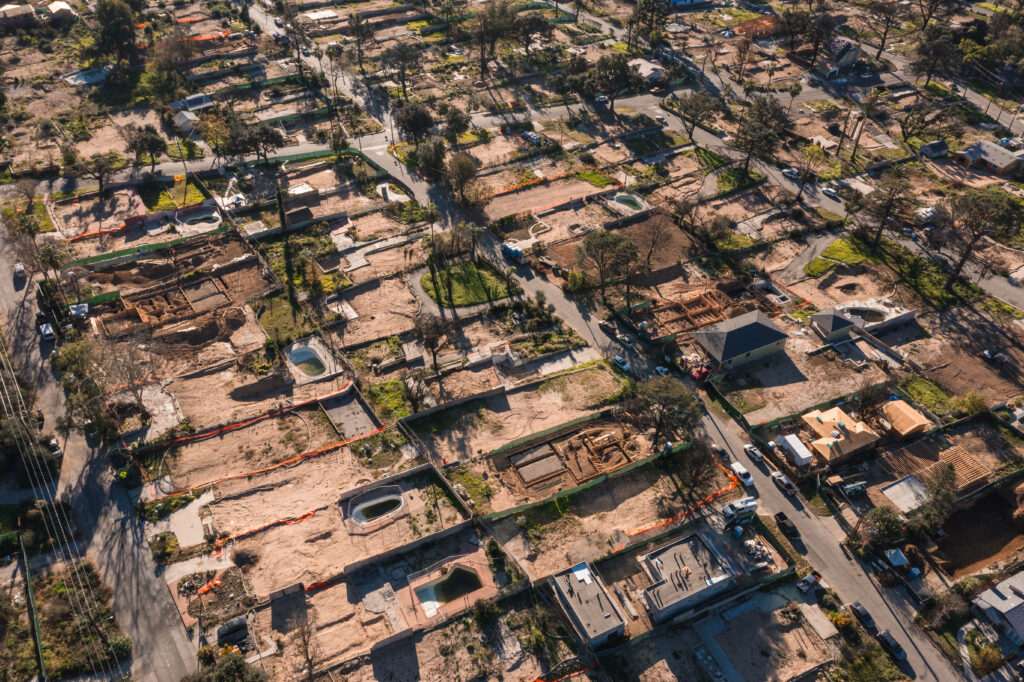
For the insurance industry, the wildfire problem has increasingly felt like a one-way street: losses compound, carriers retreat, and the residual market swells to fill the gap. The January 2025 Los Angeles fires — $40 billion in estimated losses, the most expensive urban wildfire event in American history — only accelerated that trajectory.
A landmark study released in late March 2026 by the California Department of Insurance and the National Association of Insurance Commissioners offers something the industry has been waiting for: credible, model-based evidence that the loss trajectory is not fixed. Rebuild the affected communities to established wildfire safety standards, the study concludes, and projected losses fall by 31 percent on average.
For carriers and MGAs trying to figure out how to price, underwrite, and selectively re-engage California’s distressed market, that finding is worth unpacking carefully.
What the CDI/NAIC Study Actually Found

The analysis was conducted by the NAIC’s new Catastrophe Risk Management Center of Excellence using Moody’s wildfire catastrophe model. The study examined what would happen if the communities destroyed in the Palisades and Eaton fires were rebuilt to the Insurance Institute for Business and Home Safety’s (IBHS) Wildfire Prepared Home (WPH) standard — a rigorous certification covering roofing, venting, siding, windows, decking, and the immediate perimeter around the structure.
The findings were specific and significant:
- Rebuilding to the WPH Base standard reduces Average Annual Loss by 31 percent compared to standard reconstruction.
- The WPH Plus standard — adding more stringent requirements for windows, decking, and Zone 0 vegetation management — costs approximately 3 percent more per home than minimum California building codes, but delivers substantially better loss performance.
- Independent research confirms that homes with hardening features and defensible space survive wildfire at nearly 50 percent — versus just 20 percent for unmitigated homes. That’s more than a 2.5x survival differential.
The study also cites Paradise, California as a forward-looking proof of concept. After adopting the IBHS standard as its official rebuilding benchmark following the 2018 Camp Fire, Paradise homeowners who rebuilt to those specifications have seen insurance costs drop by as much as 800 percent compared to the California FAIR Plan. That’s not a rounding error — it reflects a genuine, measurable shift in risk profile that private carriers are pricing.
“The core implication for the industry: the problem isn’t that wildfire risk is uninsurable. The problem is that the existing housing stock was built to standards that predate modern wildfire science — and the market hasn’t yet developed the tools to efficiently separate what’s insurable from what isn’t.”
The Underwriting Signal the Market Has Been Missing
The CDI study is significant at the macro level, but it raises a practical challenge: knowing that WPH-standard homes perform better in aggregate doesn’t tell a carrier or MGA which individual properties in their book have the underlying characteristics that drive that performance difference.
That’s where property-level scoring becomes essential — and where our own research at Property Guardian adds precision to the CDI study’s directional findings.
Our Wildfire Resiliency Score Sub-Factor Analysis examined 529 properties within 5 km of fire perimeters, with 108 matched to DINS (Damage Inspection) records for confirmed destruction outcomes. The analysis used logistic regression to isolate which components of the risk score actually predict destruction.
The finding that matters most for underwriters:
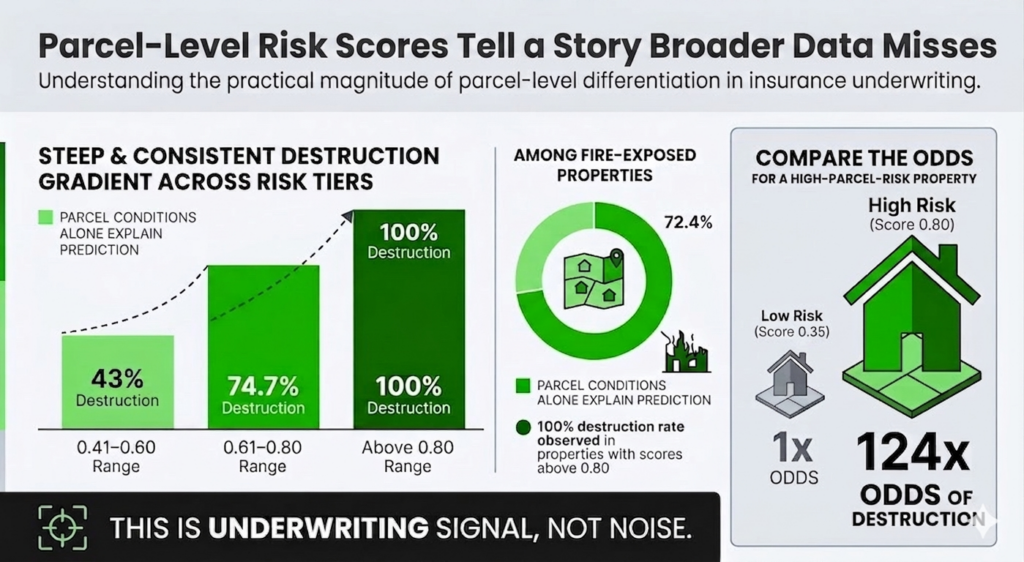
Among fire-exposed properties, parcel-level conditions account for 72.4% of destruction prediction. Area-level factors — community and region scores — which dominate exposure prediction, show near-zero predictive power for survival once fire has arrived.
In other words, the CDI study’s loss reduction comes from exactly the mechanism our property-level analysis identifies: the parcel conditions captured by the IBHS standard are the same characteristics that statistically separate survivors from losses in a fire event.
What the Numbers Look Like at the Property Level
The practical magnitude of parcel-level differentiation is larger than most underwriters assume. Our analysis found:
- 124x higher odds of destruction for a high-parcel-risk property (score 0.80) vs. a low-risk property (score 0.35)
- 72.4% of destruction prediction explained by parcel conditions alone among fire-exposed properties
- 100% destruction rate observed among properties in the highest parcel-risk tier (score above 0.80)
The destruction rate gradient across parcel risk tiers was steep and consistent: 43% destruction for properties in the 0.41–0.60 range; 74.7% for the 0.61–0.80 range; 100% for properties above 0.80. That kind of differentiation is underwriting signal, not noise.
The implication for carriers and MGAs is direct: a portfolio that could distinguish between a 0.35-parcel-score property and an 0.80-parcel-score property would be writing two fundamentally different risks — but without property-level scoring, both might look identical from a standard application.
The Two-Stage Risk Model: What It Means for Portfolio Construction
One of the clearest insights from our analysis is that wildfire risk operates in two distinct stages, and the factors that matter at each stage are different.
Stage 1 — Exposure: Area-level factors (community and regional fire dynamics, topography, fuel conditions) determine whether fire reaches a property at all. In our sample, High-risk properties had a 65.3% impact rate; Moderate-risk, 20.7%; Low-risk, 0%. Geographic selection — using area-level scores to avoid the highest-exposure locations — is the first filter.
Stage 2 — Survival: Once fire arrives, area-level factors become statistically irrelevant to destruction outcome. Parcel conditions take over entirely. A property’s roofing, venting, vegetation management, and immediate perimeter — the exact elements the IBHS WPH standard addresses — are what determine the loss.
For portfolio construction, this two-stage model has a clear implication: geographic selection handles exposure management, but it doesn’t manage severity. To manage severity, carriers and MGAs need property-level differentiation. The two tools work together, not interchangeably.
“For portfolio construction, this two-stage model has a clear implication: geographic selection handles exposure management, but it doesn’t manage severity.”
The Market Opportunity for Carriers and MGAs
The California insurance market is in structural dislocation. Between September 2024 and December 2025, FAIR Plan enrollment surged 43% as private carriers continued pulling back. A Bloomberg analysis from March 2026 found that 28% of the FAIR Plan’s total exposure now sits in largely urban, lower-fire-risk areas — markets that were never supposed to depend on a residual insurer.
That dislocation creates a genuine opportunity for carriers and MGAs with the analytical capability to price wildfire risk accurately. The market isn’t uniformly uninsurable — it’s a market where a large percentage of properties are being treated as equivalent risks when they are, in fact, dramatically different. The carrier or MGA that can write the 0.35-parcel-score property at an accurate price while avoiding the 0.80-parcel-score property has a profitable book. The carrier writing both at the same rate has a loss problem.
The CDI/NAIC study provides regulatory and reputational cover for a more differentiated approach: rebuilding to IBHS standards is now a government-validated path to reduced losses, not just an industry preference. Carriers who price this signal — and offer meaningful premium differentiation for WPH-certified rebuilds — are aligned with where California’s regulatory environment is clearly heading.
Practical Considerations for Underwriting and Portfolio Teams
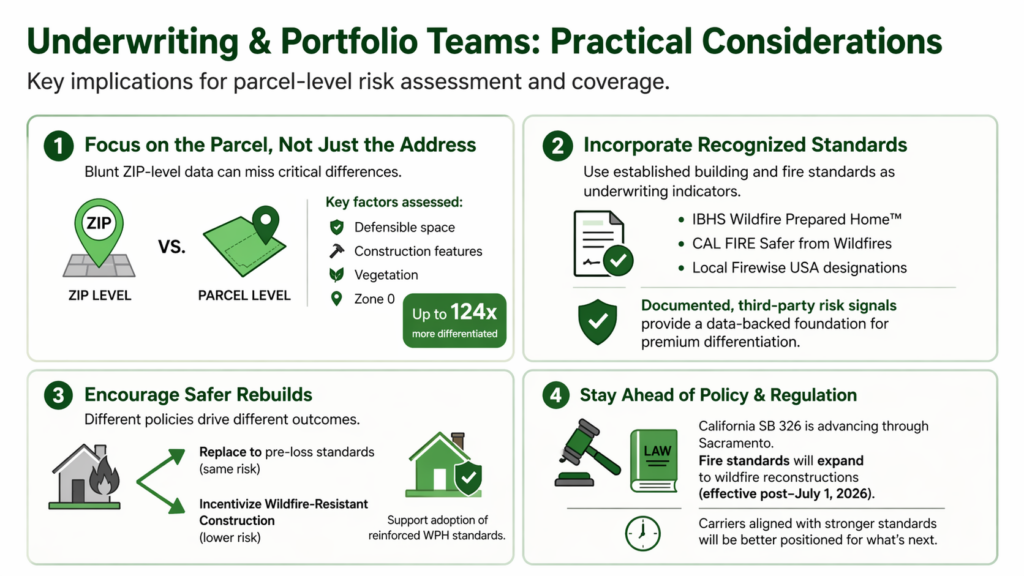
Price the Parcel, Not Just the Location. ZIP-code-level risk classification is a blunt instrument in a market where the survival differential between adjacent properties can be 124x. Property-level scoring — incorporating defensible space, construction features, vegetation conditions, and Zone 0 status — produces the differentiation that geographic risk tiers alone cannot.
Use Building Standards as an Underwriting Signal. The IBHS Wildfire Prepared Home certification, CAL FIRE’s Safer from Wildfires framework, and local Firewise USA designations are increasingly available as documented, third-party-verified signals of reduced parcel risk. These certifications represent exactly the parcel conditions our analysis identifies as predictive of survival. Building them into underwriting guidelines creates a defensible, data-backed basis for premium differentiation.
Think About Rebuild Policy Differently. The CDI study’s findings have direct implications for how carriers structure reconstruction coverage. A policy that simply covers replacement cost to pre-loss standards may be rebuilding the same risk that burned. Policies that incentivize or require rebuilding to WPH standards — potentially with a modest premium reduction tied to certification — create a better long-term risk profile for the insured and the carrier simultaneously.
Watch the Legislative Pipeline. California’s SB 326, working through Sacramento, would extend fire protection building standards to all reconstruction of buildings destroyed in wildfires occurring after July 1, 2026. If passed, it would effectively mandate a version of what the CDI/NAIC study recommends. Carriers and MGAs who have already built WPH-standard compliance into their underwriting frameworks will be ahead of the curve when that becomes the baseline requirement.
The Broader Implication
The CDI/NAIC study is a meaningful signal that California’s wildfire insurance market is not permanently broken — it’s mispriced. The risk is real, but it’s also differentiable. Properties built to wildfire safety standards produce a fundamentally different loss profile than properties built to minimum code. Our parcel-level analysis confirms that difference is measurable, consistent, and large enough to underwrite against.
The carriers and MGAs who find a path back into California’s market — or who expand within it — will be the ones who can accurately identify which properties represent the 31% better loss scenario the CDI study describes, and price them accordingly. That requires property-level data and scoring infrastructure that goes beyond what traditional geographic risk tiers provide.
About the Property Guardian Resiliency Score
The Property Guardian Wildfire Resiliency Score Sub-Factor Analysis was conducted by James Jirsa, Head of Analytics & AI. The study analyzed 529 properties within 5 km of fire perimeters, with 108 matched to DINS records for confirmed destruction outcomes, using logistic regression to isolate the relative contribution of structure, parcel, community, and regional factors at both the exposure and survival stages of wildfire risk.
For information on how the Wildfire Resiliency Score can be integrated into underwriting workflows, contact us today.
Sources & Further Reading
California Department of Insurance: Landmark Study Press Release (March 2026)
Insurance Journal: Study: Rebuilding LA to Wildfire Safety Standards Could Lower Future Fire Losses
CDI Wildfire Safety and Insurability Briefing (full PDF)
Bloomberg: California Insurance Crisis Hits Even Homes Facing Lower Wildfire Risk